Most people working in or around digital marketing have come across SEO reports. Sometimes they’re eye-glazing spreadsheets packed with keyword rankings. Other times, they’re slick slide decks loaded with graphs that look impressive but don’t say much. The truth? An SEO report is only useful if it helps someone make a decision. It’s a communication tool, not just a performance log.
Let’s break down what SEO reports actually are, what goes into a good one, and why they matter more than many realize.
Not Just a Report – It’s Your Strategy in Motion
An SEO report is a structured summary of how a website is performing in organic search. That’s the short version. But a well-built report isn’t just a snapshot of rankings and clicks. It reflects your priorities, tells the story of your recent efforts, and points to what you should do next.
It’s like a dashboard for search visibility. Instead of glancing at dozens of tools, you get one document that pulls it all together and helps you answer: Are we heading in the right direction? What’s working? What needs a fix?
And most importantly: Is this helping the business?
How We Approach SEO Reporting at Lengreo
At Lengreo, we don’t treat SEO reports as just another deliverable. For us, it’s a conversation starter – a way to translate the real impact of strategy into something you can see, question, and act on. Each report is shaped by the goals we’ve set together with our clients. If we’re scaling lead generation for a SaaS company or improving the visibility of a biotech platform, that focus shows up in the way we track, interpret, and present the data.
Our team doesn’t just export rankings and bounce rates. We look at what those numbers mean in the bigger picture – how a keyword shift ties to changes in conversion rate, or what a spike in traffic actually did for qualified pipelines.
We also stay hands-on throughout. Whether we’re optimizing local SEO, building content strategies, or running outreach campaigns, reporting is never the last step. It’s how we keep refining the strategy – how we stay aligned, accountable, and ready to adjust when things shift. And when clients need clarity, we’re there to walk them through what changed, why it matters, and what comes next.

What Makes an SEO Report Useful?
Here’s the thing – SEO reports can go stale quickly. That happens when they’re overloaded with numbers or detached from actual business goals.
A useful SEO report does three things:
- Shows performance in clear context (not just raw data).
- Connects search metrics to real-world results.
- Highlights specific actions or decisions.
This isn’t just about pleasing the boss. It’s about staying grounded, especially when SEO campaigns stretch over months or even years.
Who’s It For? (And Why That Changes Everything)
One of the biggest mistakes people make is assuming an SEO report is one-size-fits-all. It’s not.
Depending on the audience, your report will need a different tone, format, and depth. Here’s a rough breakdown:
- Executives and founders care about ROI, market visibility, and impact on sales. Keep it brief, visual, and aligned with business goals.
- Marketing teams need to track campaign results, keyword performance, and content opportunities. They’ll want more detail and insights.
- Product and UX folks might look for user behavior, query intent, or mobile performance.
- Clients, especially small business owners, just want to see clear wins and easy-to-understand progress.
Each group speaks a different language. The best reports translate SEO into something meaningful for them.
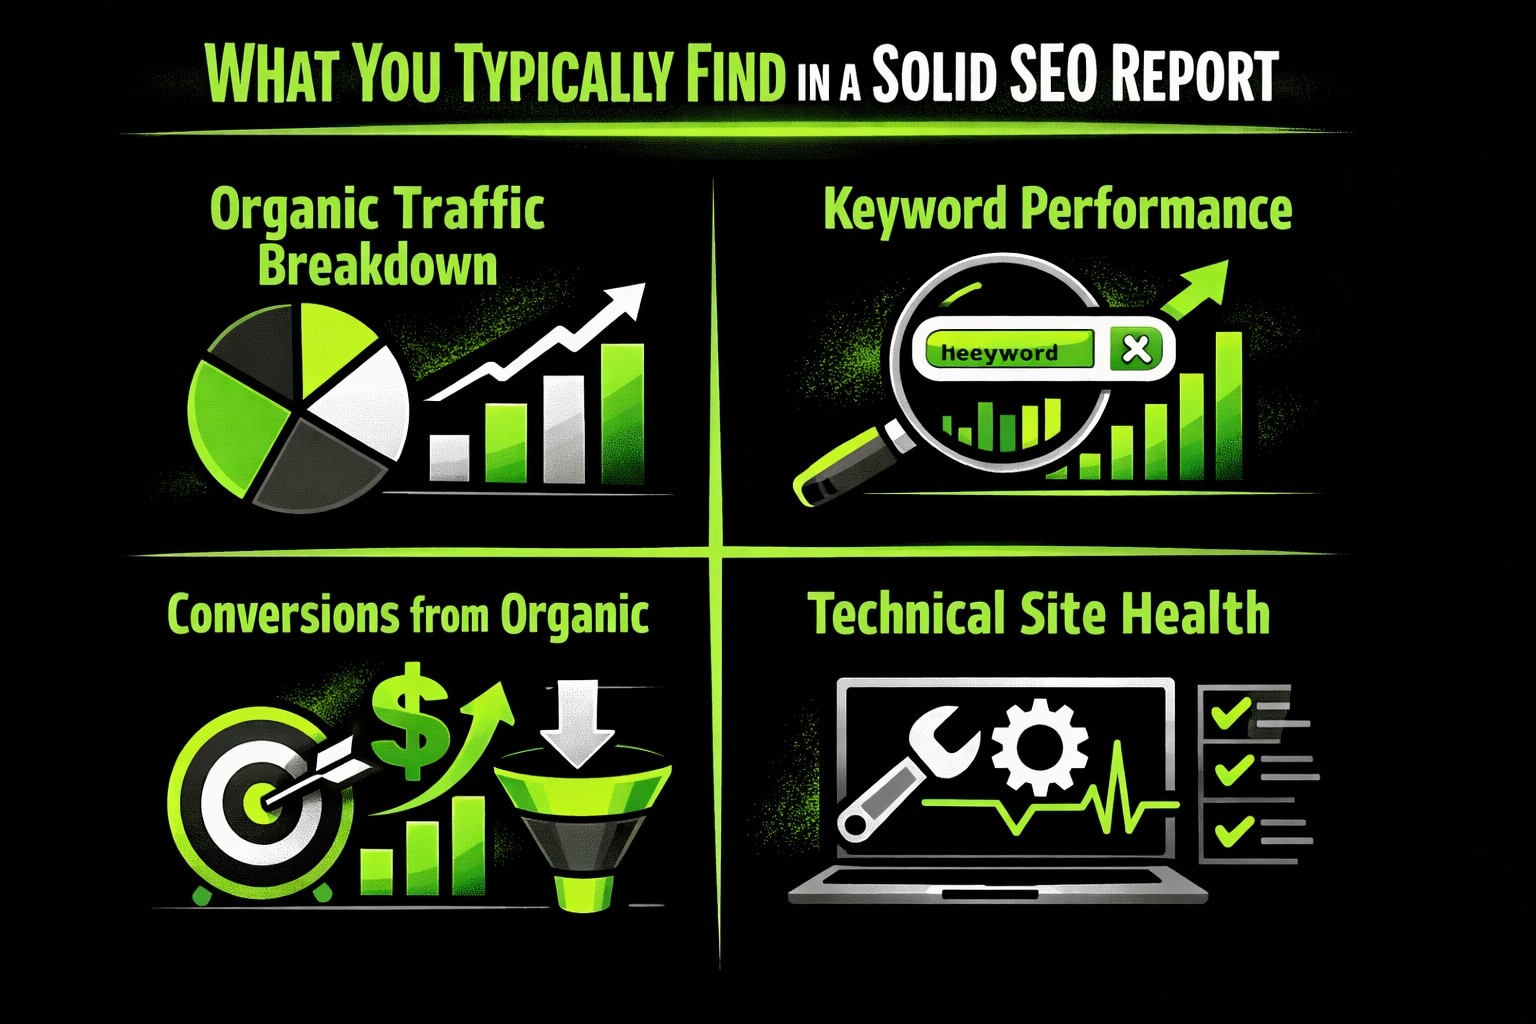
What You’ll Typically Find in a Solid SEO Report
There’s no universal formula, but here are the common ingredients that appear in most well-rounded SEO reports:
1. Organic Traffic Breakdown
This is usually the first thing people look at in a report, and for good reason. Organic traffic shows how many people are finding the site through search engines like Google, and what happens once they land there. You’re not just measuring visits, though.
You’re looking at patterns – how many users came in, how many of them were new versus returning, what pages they landed on, which countries or devices they came from, and how all of that changed over time. Without that historical view, even a solid traffic number doesn’t tell you much. It’s the trendline that really matters.
2. Keyword Performance
Once you’ve got a sense of the traffic, the next question is: what keywords brought those people in? This part of the report digs into your rankings – which terms are climbing, which ones slipped, and which are starting to show potential. It’s not just about page-one bragging rights. You want to understand which keywords are actually pulling their weight, especially the non-branded ones that indicate new discovery. It also helps to group keywords by theme, so you’re not just chasing isolated wins but building strength in core topic areas.
3. Conversions from Organic
Traffic is nice, but it only gets you so far. What really matters is what people do once they arrive. This section can reflect meaningful actions if conversion tracking is properly set up and integrated with relevant analytics platforms.
These touchpoints help you measure the actual value of organic visits. Without conversion data in the report, you’re left guessing whether visibility is translating into results, which can make even strong traffic numbers feel a bit hollow.
4. Technical Site Health
Search engines care a lot about how a site performs technically. So should you. This section focuses on things that affect how easily your content gets crawled, indexed, and ranked. You’re looking at page speed (especially on mobile), Core Web Vitals like load times and layout stability, and whether any errors are blocking users or bots – things like broken links, unindexed pages, or redirect issues. If your site is technically weak, it can significantly hinder SEO performance – though strong content and backlinks may sometimes compensate to an extent.
5. Backlink Profile
What others say about your site still matters a lot. That’s where backlinks come in. This part of the report gives you a picture of how many links you’ve earned, where they’re coming from, and what kind of authority those domains carry. It also shows if you’ve lost any valuable links or picked up spammy ones that might hurt you. If you’re running outreach or publishing content for visibility, the backlink section helps track whether those efforts are paying off in the eyes of search engines.
How to Turn Raw Data into Something People Actually Read
Data is just numbers until you add context.
Here’s where many reports fall short: they stop at charts and tables. The best ones explain what those numbers mean and what should happen next.
Some questions your report should always answer:
- What has changed since last time?
- Why did it change?
- Is that good or bad?
- What’s the plan moving forward?
Think of yourself as a translator. You’re turning analytics into stories and stories into decisions.
Time-Based Comparisons: The Secret Sauce
One of the simplest ways to make an SEO report more insightful is to track how things shift over time. That doesn’t mean overwhelming people with five months of raw numbers packed into a spreadsheet. It means pulling out the changes that actually matter.
Maybe your organic traffic jumped by 17% compared to last month, and most of that lift came from a couple of blog posts that recently hit page one. Or maybe you noticed a handful of keywords slipping out of the top 10 right after a Google core update, which could hint at a broader algorithm shift.
Sometimes the overall conversion rate stays flat, but a single landing page sees a major lift after tweaking the call-to-action. These kinds of details help teams cut through the noise and stay focused on what’s really driving movement.
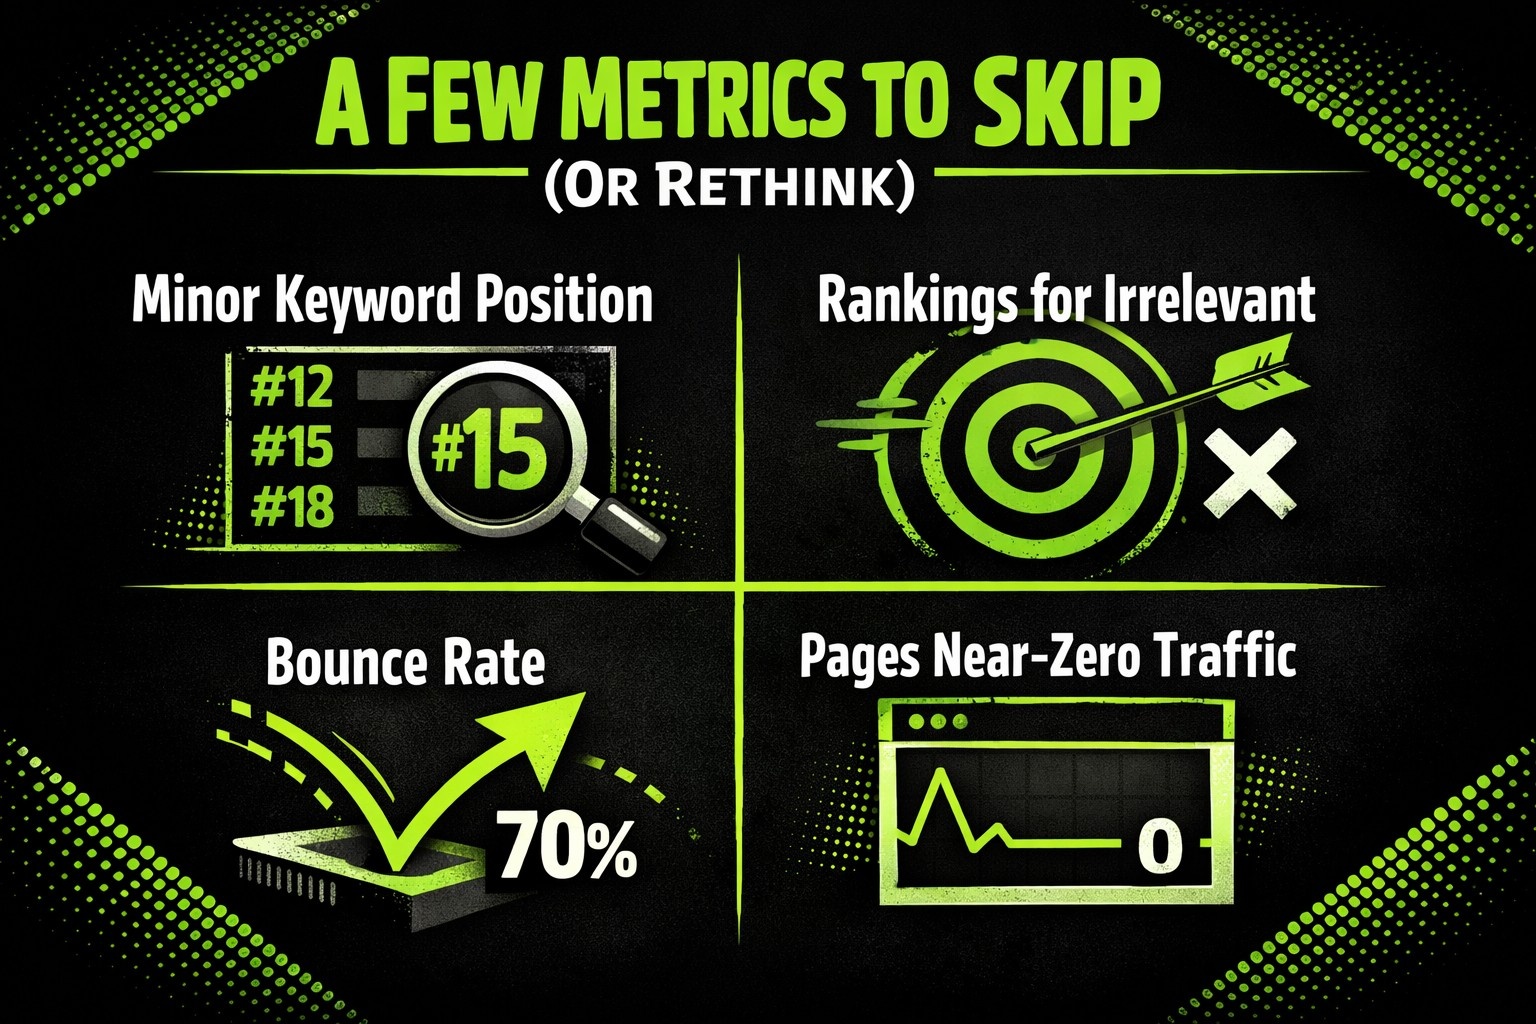
A Few Metrics You Might Want to Skip (Or Rethink)
It’s tempting to track everything. But more isn’t always better. In fact, clutter can kill a report.
You might want to leave out:
- Minor keyword position changes (if they’re not driving traffic or tied to business goals).
- Rankings for irrelevant or outdated terms.
- Bounce rate on its own (without time-on-site or context).
- Pages with near-zero traffic unless they’re strategic.
Always ask: “Will this help someone make a better decision?” If not, it’s probably just noise.
Manual vs. Automated Reporting: Pick Your Weapon
There’s no right answer here. Some folks love spreadsheets and pulling data themselves. Others rely on third-party platforms.
Here’s a quick comparison:
Manual Reports:
- Fully customizable.
- Ideal for high-touch clients.
- Time-consuming and error-prone.
- Great for learning SEO inside-out.
Automated Reports:
- Save time with templates.
- Easy to schedule and scale.
- Sometimes too rigid.
- Best for recurring updates and dashboards.
A hybrid approach works well too: use automated tools to gather data, then add your own commentary and context.
Ways to Make Your SEO Report Stand Out
If you’re building reports regularly, here are a few pro moves to level up your game:
- Use visual storytelling: Charts with annotations > raw data dumps.
- Add short videos: A 3-minute walkthrough can go a long way.
- Include footnotes or glossaries: Great for less technical audiences.
- Create modular templates: Makes it easy to adapt for different clients.
- Keep a running doc of past reports: Helps with long-term trend analysis.
It’s not about making it pretty for the sake of it. It’s about making it easy to understand and act on.
Final Thoughts
At the end of the day, a great SEO report does more than track progress. It builds relationships. It proves your value without hype. And it helps everyone stay focused on what matters.
Whether you’re a freelancer trying to land renewals or a marketing lead navigating tight budgets, your report is one of the most powerful tools you’ve got.
Don’t treat it like homework. Treat it like what it really is: your case for why your work matters.