


Quick Summary: Measuring SEO in Google Analytics requires connecting Google Search Console to your GA4 property, tracking organic traffic sessions, analyzing landing page performance, and monitoring key metrics like engagement rate, conversions, and revenue attribution. The most comprehensive approach combines GA4’s traffic-source dimensions with Search Console’s query and position data for a complete picture of organic search performance.
Peter Drucker’s famous quote rings especially true for search optimization: “If you can’t measure it, you can’t improve it.” According to HubSpot (cited in Search Engine Journal), 61% of respondents say generating traffic and leads is their most significant marketing challenge. Without proper measurement, proving the value of SEO work becomes nearly impossible.
Google Analytics 4 has fundamentally changed how websites track organic search performance. The transition from Universal Analytics brought new terminology, different data models, and most importantly—new ways to measure what matters.
But here’s the thing: GA4 alone doesn’t tell the complete SEO story. Real measurement requires connecting multiple data sources and understanding which metrics actually drive business results.
Why Google Analytics and Search Console Work Better Together
Google Analytics tracks what happens after users land on a site. Search Console tracks what happens before—the queries, impressions, and rankings that bring users there in the first place.
According to the official Google Analytics Help documentation, connecting Search Console to GA4 unlocks the Google Organic Search Traffic report, a pre-made detail report that displays landing pages with associated Search Console and Analytics metrics. This integration shows where sites rank in search results, which queries lead to clicks, and how those clicks translate to user behavior.
The integration reveals connections that neither tool shows independently. For example, which high-ranking keywords actually drive engaged sessions? Which landing pages convert searchers into customers? How does organic search revenue compare to paid channels?
Search Console keeps data for the last 16 months maximum. As a result, reports in Analytics also include a maximum of 16 months of historical data. Search Console data appears in both platforms 48 hours after collection.
Setting Up SEO Measurement in Google Analytics 4
Before tracking any metrics, the technical foundation needs to be in place. This means proper GA4 configuration and Search Console integration.
Connect Search Console to Your GA4 Property
According to the official Google Analytics documentation, creating the integration requires linking a Google Analytics 4 web data stream with a Search Console website property. The connection can be initiated from either platform.
In Analytics, administrators navigate to the Admin section, select the property, and choose “Search Console links” under Property settings. After selecting the appropriate Search Console property, the linking process takes just a few minutes.
Once connected, two new reports become available: Google Organic Search Traffic and Google Organic Queries. These reports won’t appear in the left navigation by default but can be accessed through the Reports section.
Configure Traffic-Source Dimensions
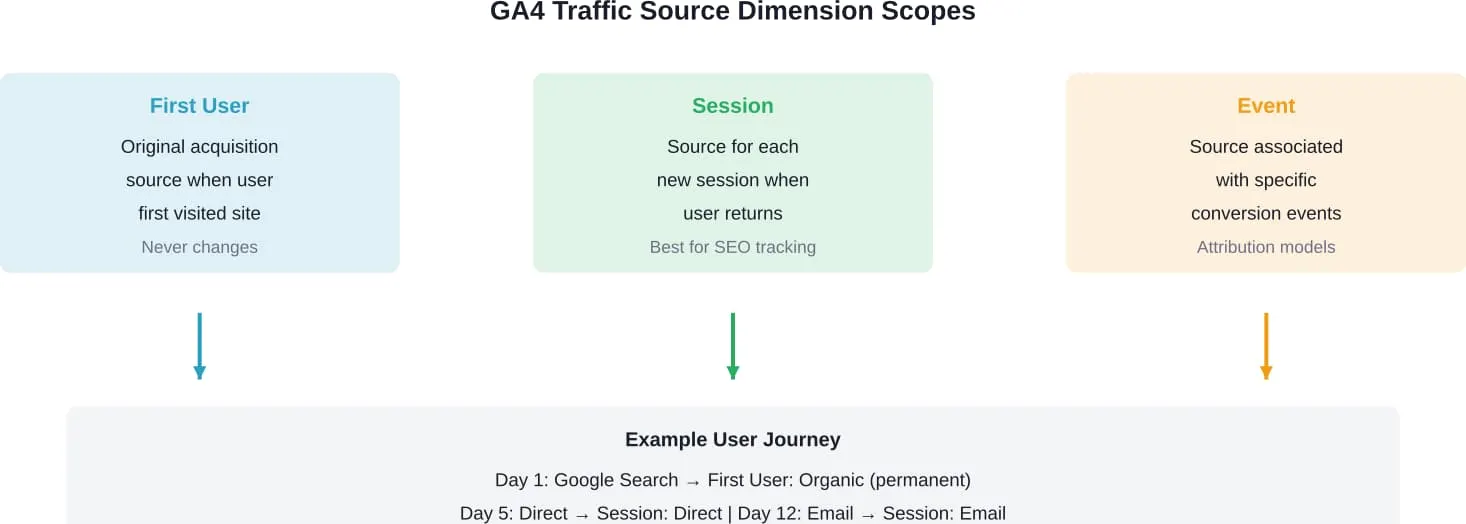
GA4 uses traffic-source dimensions to provide information about where traffic originates, the methods users arrive through, and the specific marketing efforts driving that traffic. According to Google’s official documentation, these dimensions include prefixes like “First user” or “Session” to provide more attribution information.
The scopes matter significantly:
- First user dimensions track the very first source that brought a user to the site
- Session dimensions track the source for each new session
- Event dimensions track the source associated with specific conversion events
For SEO measurement, session-scoped dimensions typically provide the most actionable insights because they show how organic search performs as an ongoing channel, not just an acquisition source.
Essential SEO Metrics Available in Google Analytics 4
Not all metrics carry equal weight for SEO measurement. Some vanity metrics look impressive but don’t connect to business outcomes. Others directly indicate whether organic search drives valuable results.
Organic Sessions and Users
Sessions represent periods of time during which users interact with a website. According to Google’s official documentation, a session starts when a user arrives on a site and ends after 30 minutes of inactivity or at midnight.
In GA4, organic sessions are filtered by medium=”organic” in the session source dimensions. This metric shows the volume of visits originating from unpaid search results.
Users represent unique individuals visiting the site. GA4 counts users across devices when signed in, providing more accurate counts than the old cookie-based system. The distinction matters: 1,000 sessions might come from 600 users, with some returning multiple times.
Real talk: sessions alone don’t prove SEO success. But tracking trends over time reveals whether optimization efforts increase search visibility.
Engagement Rate and Engaged Sessions
GA4 replaced the old bounce rate metric with engagement rate—a more meaningful measure of quality traffic. According to the official Google Analytics documentation, engagement rate shows the percentage of sessions that were engaged sessions.
An engaged session meets at least one of these criteria:
- Lasted 10 seconds or longer
- Had a key event (conversion)
- Had 2 or more page views
For SEO measurement, comparing engagement rates across traffic sources reveals whether organic search brings genuinely interested visitors. Organic traffic with a 68% engagement rate outperforms paid traffic at 51%, even if paid brings more total sessions.
According to Google Analytics Model comparison report data, organic traffic can show higher engagement rates than paid channels (example: 68.25% organic vs 51.22% CPC). This makes sense—users actively searching for specific information tend to engage more deeply than interrupted users clicking ads.
Landing Page Performance
Landing pages represent the entry point for user sessions. The Landing Page report in GA4 shows how users interact with different pages, including sessions, session duration, and events triggered.
For organic search traffic specifically, the Google Organic Search Traffic report shows landing pages with combined Search Console and Analytics metrics. This reveals which pages attract search traffic and which actually engage and convert that traffic.
A page ranking well but showing low engagement rate might have content that doesn’t match search intent. Conversely, pages with high engagement but low impressions represent optimization opportunities—the content satisfies users when they find it, but visibility needs improvement.
Key Events and Conversions
GA4 uses “key events” (formerly called conversions) to track important user actions. These might include form submissions, purchases, downloads, or video views—whatever actions indicate business value.
For meaningful SEO measurement, tracking which key events organic traffic drives is essential. According to UPCEA research, 62% of institutional leaders want SEO reporting, but just 31% receive regular updates, highlighting the gap in regular performance communication.
The Conversions report filtered by organic traffic shows exactly how search visitors contribute to business goals. This data transforms SEO from a technical practice into a revenue-driving channel.
Revenue Attribution
According to Moz, most SEO reports still lead with rankings, clicks, or traffic lifts. But senior stakeholders care about revenue impact and profit contribution. GA4’s attribution models show how organic search contributes to revenue across the customer journey.
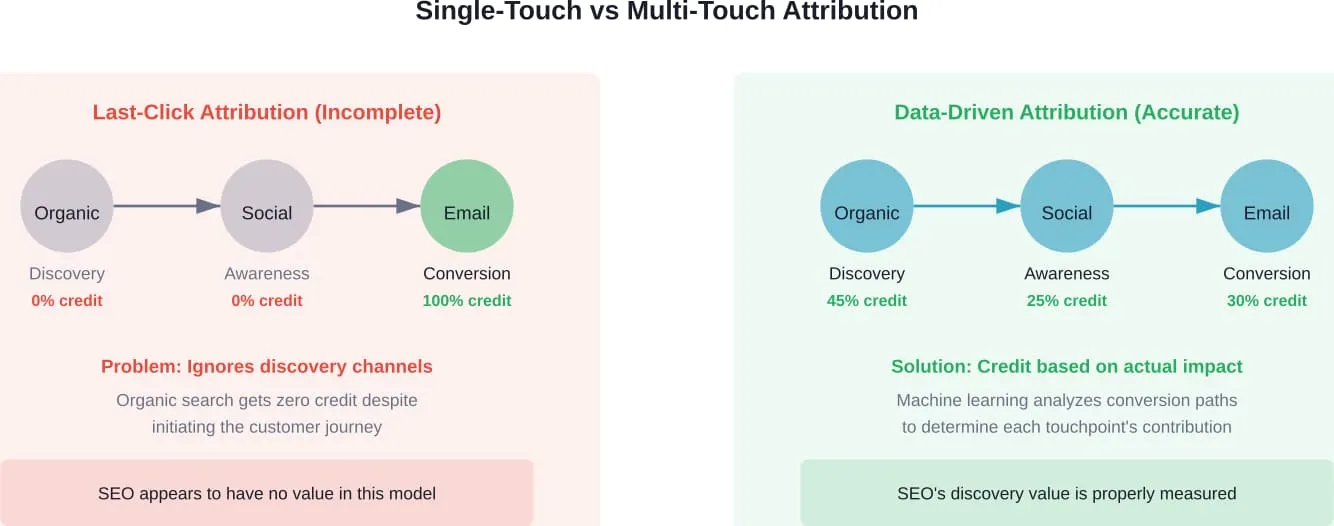
The platform uses different attribution models to assign credit:
- Last click: 100% credit to the final touchpoint before conversion
- First click: 100% credit to initial discovery channel
- Data-driven: Credit distributed based on actual contribution (GA4 default)
According to Google’s official documentation, GA4 defaults to data-driven attribution, which uses machine learning to analyze conversion paths and assign credit based on actual impact. This provides more accurate SEO value measurement than arbitrary rule-based models.
The Model comparison report shows how organic search performs under different attribution approaches, revealing its role in both customer acquisition and deal closing.
| Attribution Model | What It Shows | Best For |
|---|---|---|
| Last Click | 100% credit to final touchpoint | Understanding immediate conversion drivers |
| First Click | 100% credit to initial discovery | Measuring acquisition channel effectiveness |
| Data-Driven | Credit based on actual contribution | Most accurate overall channel value (GA4 default) |
| Linear | Equal credit to all touchpoints | Understanding full customer journey |
| Time Decay | More credit to recent touchpoints | Short sales cycles with multiple touches |
Accessing Key SEO Reports in GA4
GA4’s interface organizes reports differently than Universal Analytics. Knowing where to find organic search data saves significant time.
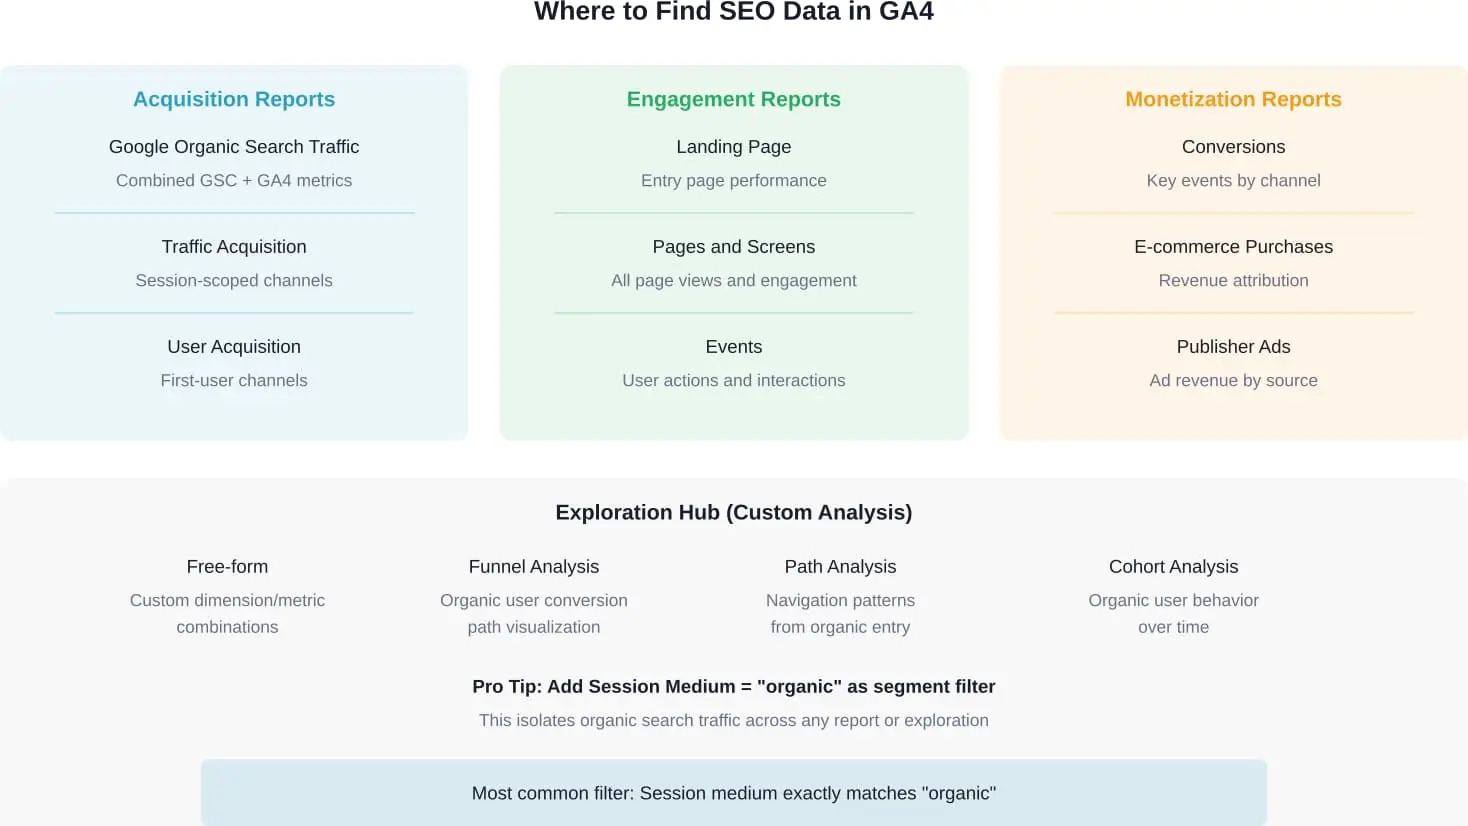
The Google Organic Search Traffic Report
This pre-made detail report becomes available after connecting Search Console. According to the official documentation, it displays landing pages with associated Search Console and Analytics metrics for the linked property.
The report isn’t available in left navigation by default. Access it through Reports > Life cycle > Acquisition > Google Organic Search Traffic.
The report combines crucial data from both platforms:
- Landing page URLs
- Search queries driving traffic
- Impressions and click-through rate (from Search Console)
- Sessions and engagement metrics (from Analytics)
- Key events and revenue (from Analytics)
Drilling down by Country and Device dimensions reveals geographic and platform-specific performance patterns.
Traffic Acquisition and User Acquisition Reports
These standard reports show how different channels drive traffic. The Traffic acquisition report uses session-scoped dimensions, showing the source for each session. The User acquisition report uses first-user dimensions, showing original discovery channels.
For ongoing SEO performance tracking, the Traffic acquisition report filtered to “organic” medium provides the clearest view. It shows current organic search performance without being skewed by users acquired through other channels months ago.
Landing Page Report
The standard Landing page report (Life cycle > Engagement > Landing page) shows all entry pages regardless of traffic source. Adding “Session medium” as a secondary dimension filters the view to show only organically-driven landing pages.
This report excels at identifying top-performing organic content and pages needing optimization. Sort by engagement rate to find pages where content matches search intent. Sort by sessions with low engagement to find optimization opportunities.
Custom Explorations for Advanced Analysis
GA4’s Exploration tools enable deeper analysis beyond standard reports. Free-form exploration allows combining any dimensions and metrics for custom views.
Useful explorations for SEO include:
- Organic landing pages by device category and engagement rate
- Session source/medium combinations leading to specific key events
- User cohorts based on first acquisition source, segmented by behavior
- Funnel analysis showing organic user progression through conversion steps
Critical SEO KPIs Beyond Basic Traffic
Tracking sessions and users forms the foundation. But proving SEO value requires connecting organic search to business outcomes.
Organic Search Conversion Rate
This metric shows what percentage of organic sessions result in key events. Calculate it by dividing total key events from organic traffic by total organic sessions.
If organic search drives 10,000 sessions and 500 key events, the conversion rate is 5%. Comparing this to other channels reveals whether search traffic quality matches or exceeds alternatives.
Many SEO strategies dedicate significant effort and resources but fail to analyze results effectively. Conversion rate provides the clearest indicator of whether traffic quality matches traffic quantity.
Revenue Per Organic Session
For e-commerce sites or businesses tracking monetary value, revenue per session shows the average value each organic visit generates. Access this through the Monetization reports, filtered by organic medium.
This metric directly answers executive questions about SEO ROI. If organic search drives 50,000 sessions generating $125,000 in attributed revenue, each session generates $2.50 in value. Multiply that by projected traffic growth to forecast future revenue impact.
Assisted Conversions
According to Google’s attribution documentation, customers often interact with multiple touchpoints before converting. Organic search frequently plays an assistive role—introducing users who later convert through other channels.
The Key event paths report (under Advertising) shows how organic search contributes across multi-touch journeys. Many conversions follow patterns like “Organic Search → Direct → Email → Purchase” where organic search initiated discovery but other channels closed the deal.
Measuring only last-click conversions systematically undervalues organic search’s true contribution.
Click-Through Rate from Search Results
While technically a Search Console metric, CTR becomes visible in GA4 after integration. CTR represents the ratio of impressions to clicks—if a page has 100 impressions and 50 clicks, CTR is 50%.
The Google Organic Search Traffic report shows CTR alongside engagement metrics, revealing whether high-impression pages actually attract clicks. Low CTR despite strong rankings suggests title tags and meta descriptions need optimization.
Engagement Time Per Session
GA4 tracks engaged time—the duration users actively interact with content. This metric filters out inactive browser tabs, providing more accurate attention measurement than old “time on page” metrics.
Organic traffic showing high engagement time indicates strong topic-audience fit. Content satisfies search intent when users spend substantial time reading and interacting.
| Metric | What It Measures | Why It Matters | Where to Find It |
|---|---|---|---|
| Organic Sessions | Volume of search visits | Shows visibility and reach | Traffic Acquisition report |
| Engagement Rate | % of quality sessions | Indicates traffic relevance | Traffic Acquisition report |
| Conversion Rate | % of sessions with key events | Shows business impact | Conversions report (filtered) |
| Revenue Per Session | Average value per visit | Quantifies ROI directly | Monetization reports |
| CTR | Impressions to clicks ratio | Measures SERP effectiveness | Google Organic Search Traffic |
| Assisted Conversions | Multi-touch contributions | Shows full funnel value | Key event paths report |
Understanding Data Discrepancies Between Tools
Integrated reporting reveals something frustrating: the numbers don’t match perfectly between Search Console and Analytics. This is normal and expected.
According to Google’s official documentation, several factors cause discrepancies between Search Console and Analytics:
- Tracking timing differences: Search Console records clicks when they occur. Analytics records sessions when GA4 loads on the landing page. If users click but the page never loads, Search Console counts it while Analytics doesn’t.
- Processing delays: Search Console data appears 48 hours after collection. Analytics processes data differently, sometimes showing information sooner for some events.
- Filtering and sampling: GA4 applies data filters and sometimes samples large datasets. Search Console shows all search interactions regardless of subsequent site behavior.
- Definition differences: Search Console counts “clicks” while Analytics counts “sessions.” One click can start one session, but users clicking multiple search results create multiple clicks leading to one session.
These discrepancies don’t invalidate either tool. They measure related but distinct things. Use Search Console to understand search visibility and behavior. Use Analytics to understand on-site engagement and conversions after users arrive.
Setting Up Meaningful SEO Goals and Key Events
Generic key events like “page view” or “session start” don’t provide actionable insights. Meaningful measurement requires defining what success looks like for specific business objectives.
Identify Business-Relevant Actions
What actions indicate SEO is driving value? The answer varies by business model:
- E-commerce: Product views, add to cart, purchases, revenue
- Lead generation: Form submissions, phone clicks, demo requests
- Content/publishing: Article completions, newsletter signups, ad impressions
- SaaS: Trial signups, feature usage, upgrade conversions
Determining exactly which actions matter and assigning them value enables ROI calculation. For example, if form submissions lead to sales consultations, and 30% of consultations close at $5,000 average contract value, each form submission carries approximately $1,500 in expected value.
Configure Key Events in GA4
Navigate to Admin > Events to see all tracked events. Click “Mark as key event” for actions that indicate business value. Once marked, these events appear in conversion-focused reports.
Filtering conversion reports by organic traffic source reveals which key events SEO drives most effectively. Some organic landing pages might excel at driving newsletter signups while others drive direct purchases.
Assign Monetary Values to Non-Revenue Events
For events that don’t directly generate revenue, assigning estimated values enables ROI calculation. In GA4, event parameters can include value amounts.
If email signups convert to customers at a known rate and lifetime value, calculate backward to determine what each signup is worth on average. This transforms “150 organic email signups this month” into “$4,500 in estimated organic signup value.”
Measure SEO Performance the Right Way in Google Analytics
SEO should be tracked through traffic quality, conversions, and user behavior. Lengreo sets up tracking that connects rankings to real business outcomes. The team configures reporting dashboards and conversion goals properly. This gives clarity instead of vanity metrics.
Ready to Measure Your SEO Performance Properly?
Talk with Lengreo to:
- configure SEO tracking in analytics
- define conversion goals
- build clear reporting dashboards
👉 Request an SEO performance audit from Lengreo.
Building Regular SEO Performance Reports
One-time analysis provides snapshots. Regular reporting reveals trends, validates strategies, and communicates value to stakeholders.
Monthly vs. Quarterly Reporting
SEO changes take time to show impact. Google needs weeks to crawl, index, and rank optimized content. Users need time to discover and engage with improved pages.
Monthly reporting tracks tactical progress: new rankings, traffic changes, immediate conversion impacts. Quarterly reporting better shows strategic trends: cumulative traffic growth, shifting conversion patterns, long-term ROI.
According to UPCEA research, 62% of institutional leaders want SEO reporting, but just 31% receive regular updates, highlighting the gap in regular performance communication.
Essential Report Components
Effective SEO reports balance detail with clarity. Include these elements:
- Executive summary: 2-3 sentences on key wins, challenges, and recommendations
- Traffic trends: Organic sessions and users over time, compared to previous period
- Engagement quality: Engagement rate, average engagement time, showing traffic quality
- Conversion impact: Key events and revenue attributed to organic search
- Top performers: Landing pages or queries driving most valuable traffic
- Opportunities: Pages with high impressions but low CTR, or high traffic but low engagement
Using Looker Studio for Integrated Dashboards
According to Google’s official Search Console documentation, Looker Studio can monitor metrics from both Search Console and Google Analytics together, visualizing the data in unified dashboards.
Looker Studio connects directly to both data sources, enabling custom reports that combine visibility metrics (impressions, rankings, CTR) with engagement metrics (sessions, conversions, revenue) in single views.
Template dashboards are available for common SEO reporting needs, reducing setup time from hours to minutes.
Common Measurement Mistakes to Avoid
Even with proper tools configured, measurement errors distort understanding and lead to poor decisions.
Obsessing Over Rankings Alone
High rankings mean nothing if they don’t drive qualified traffic. A #1 ranking for a low-intent keyword generates less value than a #5 ranking for a high-conversion query.
According to Moz, senior stakeholders don’t care about rankings—they want to know revenue impact. Reports leading with position changes without connecting them to business outcomes miss the point entirely.
Ignoring Attribution Windows
GA4’s default attribution window is 90 days for conversions. This means a user arriving via organic search today might not show conversion impact for weeks or months.
Short-term reports systematically undervalue channels with longer consideration cycles. B2B services, high-ticket items, and complex purchases often involve extended research periods where initial organic discovery occurs long before final conversion.
Not Segmenting by Landing Page Type
Averaging performance across all organic traffic obscures important patterns. Blog content drives different behavior than product pages. Informational queries convert differently than transactional ones.
Segment analysis by content type, funnel stage, or user intent provides more actionable insights than treating all organic traffic identically.
Overlooking Channel Interactions
According to Semrush data on marketing attribution, people see brands in multiple places before converting. Using single-touch attribution models misses these interactions entirely.
A user might discover a company through organic search, return via direct later, then convert through an email campaign. Single-touch models give 100% credit to email, ignoring organic search’s discovery role. Multi-touch attribution reveals the complete picture.
Advanced SEO Measurement Techniques
Basic reporting covers traffic and conversions. Advanced analysis reveals deeper patterns and optimization opportunities.
Cohort Analysis for Organic Users
GA4’s cohort exploration groups users by acquisition date and tracks their behavior over time. Creating cohorts of users first acquired through organic search reveals long-term value patterns.
Do organic users from January show higher retention than those from June? Do they convert faster or slower than users from other channels? These insights inform content strategy and budget allocation.
Landing Page Content Gap Analysis
Compare high-impression, low-CTR pages in Search Console against high-engagement pages in Analytics. The gap reveals content that needs optimization versus content that already performs well.
Pages with strong rankings but weak CTR need better titles and descriptions. Pages with strong CTR but weak engagement need better content that matches user expectations set by titles.
Device and Geographic Segmentation
According to the official GA4 documentation, the Google Organic Search Traffic report allows drilling down by Country and Device dimensions. These segments often reveal surprising patterns.
Mobile organic traffic might convert at different rates than desktop. Certain geographic regions might show higher engagement or revenue per session. These patterns inform both technical optimization and content strategy.
Seasonal Trend Analysis
Many businesses experience seasonal fluctuations in search demand. Comparing current performance to the same period last year provides more meaningful context than month-over-month comparisons.
A 20% traffic decrease in January might seem alarming until year-over-year data reveals January always dips 25%. Suddenly the decrease becomes a 5% improvement over normal seasonal patterns.
Connecting SEO Measurement to Business Strategy
The ultimate goal isn’t collecting data—it’s informing decisions that drive business growth.
Content Investment Decisions
Landing page performance data reveals which topics attract and convert audiences most effectively. Analyzing landing page engagement through GA4 helps identify content performance patterns and inform optimization decisions.
High-performing content categories deserve expanded investment. Low-performing topics might need reimagining or deprioritization. Data transforms content strategy from guesswork into calculated investment.
Technical Optimization Priorities
Pages with high impressions but low CTR signal technical issues—slow loading, poor mobile experience, or mismatched meta data. Engagement metrics identify pages where technical problems hurt conversion despite attracting traffic.
Prioritize technical fixes for pages that already attract significant search visibility. Optimizing a page with 100 monthly impressions generates less impact than fixing one with 10,000 impressions.
Budget Allocation Across Channels
Comparing organic search performance against paid channels informs marketing budget decisions. According to Google Analytics Model comparison report data, organic traffic can show engagement rates around 68% compared to CPC paid traffic at 51%.
When organic search demonstrates higher engagement, better conversion rates, and lower cost per acquisition than paid alternatives, the case for SEO investment becomes compelling.
Conclusion: Measurement Drives Improvement
Google Analytics 4 combined with Search Console provides comprehensive SEO measurement capabilities—but only when configured properly and analyzed thoughtfully. Traffic numbers tell part of the story. Engagement metrics add context. Conversion and revenue data complete the picture.
The most effective measurement strategies connect organic search performance to business outcomes stakeholders care about. Rankings and impressions matter only insofar as they drive engaged sessions that lead to conversions generating revenue.
As Peter Drucker famously stated, “If you can’t measure it, you can’t improve it” – underscoring the importance of data in demonstrating SEO impact. But with proper measurement in place, the impact becomes undeniable. Traffic increases quantify visibility improvements. Engagement rates demonstrate audience relevance. Conversion and revenue attribution prove business value.
Start with the basics: connect Search Console, configure key events, and build regular reporting rhythms. Then advance into attribution analysis, cohort studies, and strategic decision-making based on data patterns rather than assumptions.
The goal isn’t collecting more data—it’s generating better insights that inform smarter decisions. Measurement serves improvement. Analytics enables optimization. And proper tracking transforms SEO from a cost center into a quantifiable growth driver.
Ready to prove your SEO value? Connect Search Console to GA4 today and start tracking the metrics that matter. Configure key events aligned with business objectives, build your first organic traffic report, and establish the measurement foundation that turns search optimization into strategic advantage.