


Quick Summary: An effective SEO report for clients should include key metrics like organic traffic, keyword rankings, backlinks, and Core Web Vitals, presented in a clear format that demonstrates tangible business value. The report must align with client goals, show month-over-month progress, and translate technical data into actionable insights. Using tools like Google Search Console, Google Analytics, and specialized SEO platforms enables accurate tracking and streamlined reporting that builds trust and justifies your SEO investment.
Creating SEO reports that clients actually understand isn’t just about dumping data into a spreadsheet. It’s about telling a story with metrics that matter.
Most agencies struggle here. They either overwhelm clients with technical jargon or provide such superficial summaries that no one can make informed decisions. The gap between what clients need to know and what SEO professionals want to show creates friction in relationships.
According to Search Engine Journal, successful client relationships are built on trust, and trust is often built on how success is defined, measured and communicated. But here’s the thing—a good SEO report isn’t a calling card or a performance check. It’s a communication tool that demonstrates value and guides strategy.
This guide walks through exactly how to build SEO reports that prove ROI, maintain client relationships, and actually get read. No fluff, just the frameworks and examples that work.
What Is an SEO Report and Why It Matters
An SEO report documents the performance of search engine optimization efforts over a specific period. It tracks metrics like organic traffic, keyword rankings, backlinks, and technical health to show whether strategies are working.
The purpose isn’t just historical tracking. These reports serve multiple functions: they justify continued investment, identify areas needing attention, and align SEO activities with broader business goals.
Search Engine Journal notes that where SEO professionals go wrong is not thinking about reports as communication tools. The data never speaks for itself. Raw numbers without context leave clients confused about whether results are good, bad, or mediocre.
The Core Purpose of Client SEO Reports
Every report should answer three fundamental questions: What happened? Why did it happen? What should happen next?
Clients invest in SEO because they want business outcomes—more leads, higher revenue, better brand visibility. They don’t care about rankings for their own sake. They care about the pipeline impact.
That’s why effective reporting always connects SEO metrics to business metrics. Traffic increases mean nothing unless they translate to conversions, sign-ups, or sales.
Common Reporting Pitfalls to Avoid
Many reports fail because they focus on vanity metrics. Impressions and ranking positions look impressive but don’t always correlate with business growth.
Another trap: over-reliance on third-party authority metrics. These measures guess ranking potential but aren’t actual Google signals. According to Search Engine Journal, third-party metrics do well in guessing the ranking potential of a page in the eyes of search engines, but they are never going to be 100% accurate.
Automation is helpful, but fully automated reports often become stale and routine. They lack the strategic insight that separates a good agency from a mediocre one.
Deliver SEO With Clear Reporting and Results
Making an SEO report is one part of a bigger process, but the real value comes from ongoing SEO work with transparent performance tracking and clear outcomes.
LENGREO provides SEO services with structured reporting, showing how rankings, traffic, and leads grow over time. The focus is on clarity, consistency, and measurable impact.
- SEO strategy with clear KPIs
- transparent performance tracking
- ongoing optimization based on data
If you want SEO with reporting that shows real progress, contact LENGREO to get started.
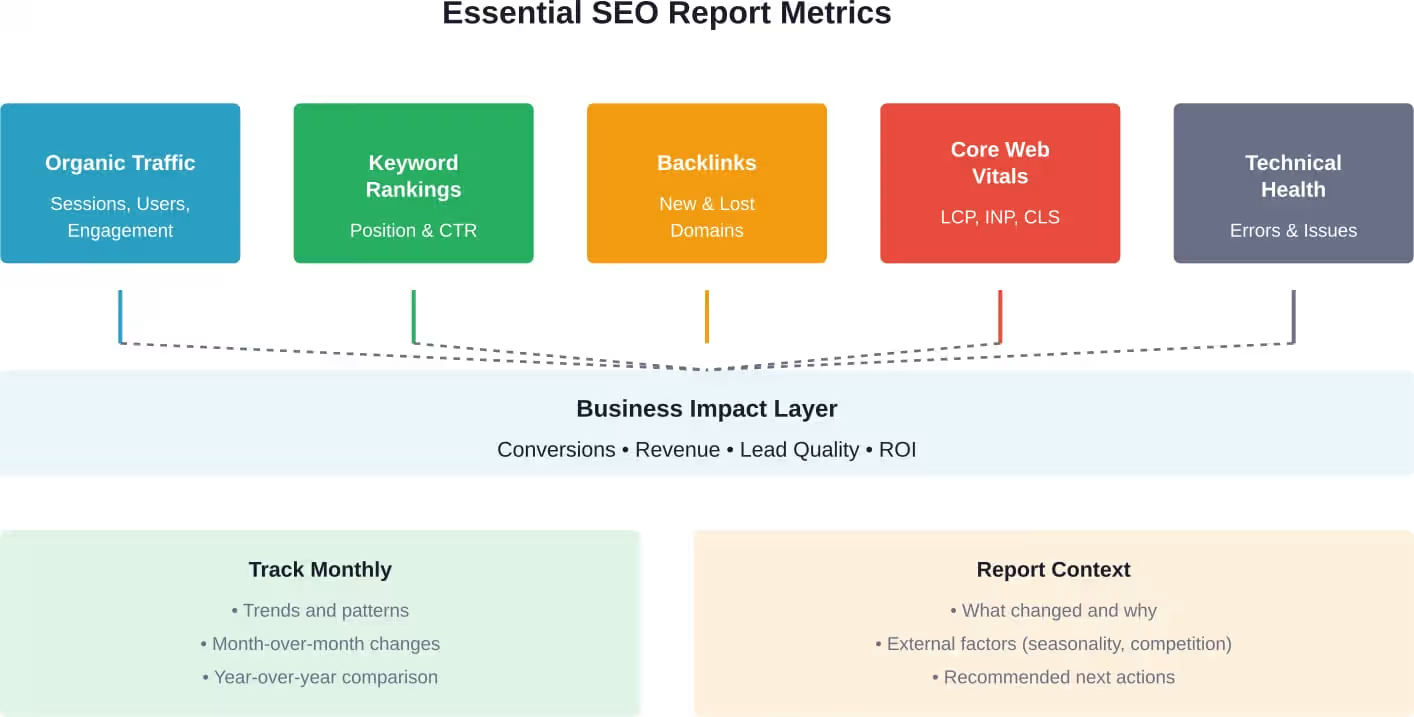
Essential Metrics to Include in Every SEO Report
Not all metrics deserve space in client reports. The key is selecting measurements that directly tie to the client’s objectives and provide actionable intelligence.
Google’s official documentation on the Performance report emphasizes tracking how search traffic changes over time, where it comes from, and which queries drive the most visibility. These form the foundation of meaningful reporting.
Organic Traffic and User Behavior
Organic traffic volume shows how many visitors arrive from unpaid search results. But raw traffic numbers need context—are these qualified visitors or just random clicks?
Segment traffic by landing page, device type, and geographic location. According to Google Search Console documentation, comparing data between countries, time periods, and devices reveals patterns that aggregate numbers hide.
Track engagement metrics like average session duration and pages per session. These indicate whether traffic is relevant. High bounce rates on important pages signal a content or user experience problem.
| Metric | What It Measures | Why It Matters |
|---|---|---|
| Organic Sessions | Total visits from search engines | Primary indicator of search visibility |
| Landing Page Performance | Which pages attract search traffic | Identifies content that resonates |
| Engagement Time | How long users interact with content | Signals content quality and relevance |
| Device Breakdown | Mobile vs. desktop traffic split | Informs optimization priorities |
| Geographic Sources | Where traffic originates | Helps tailor content strategy |
Keyword Rankings and Visibility
Track rankings for target keywords, but don’t stop there. Position alone doesn’t tell the full story—a keyword ranking fifth that drives 500 clicks is more valuable than one ranking third that generates 50.
Focus on keywords that align with business goals. Informational queries build awareness, while transactional keywords drive conversions. Different keyword types serve different funnel stages.
According to Google’s documentation on impressions and position, understanding how visibility translates to actual clicks requires examining both ranking position and click-through rates together.
Backlink Profile and Authority Signals
Backlinks remain a significant ranking factor. Report on the quantity and quality of new referring domains, lost backlinks, and the overall health of the link profile.
Quality matters more than quantity. One link from an authoritative industry publication outweighs dozens from low-quality directories.
Monitor anchor text distribution to ensure it looks natural. Over-optimized anchor text patterns can trigger manual reviews.
Core Web Vitals and Technical Health
Google’s Core Web Vitals in 2026 consist of four key metrics: Largest Contentful Paint (LCP), Interaction to Next Paint (INP), Cumulative Layout Shift (CLS), and the newly integrated Accessibility and Sustainability scores.
According to Google’s official Core Web Vitals documentation, the Core Web Vitals report shows URL performance grouped by status (Poor, Need improvement, Good), metric type (CLS, INP, and LCP), and URL group.
These metrics directly impact rankings. Sites that provide better user experiences gain an edge in competitive search results.
Technical issues like crawl errors, broken links, mobile usability problems, and indexing issues should be tracked monthly. Even small technical problems can prevent pages from ranking.
Step-by-Step Process to Create an Effective SEO Report
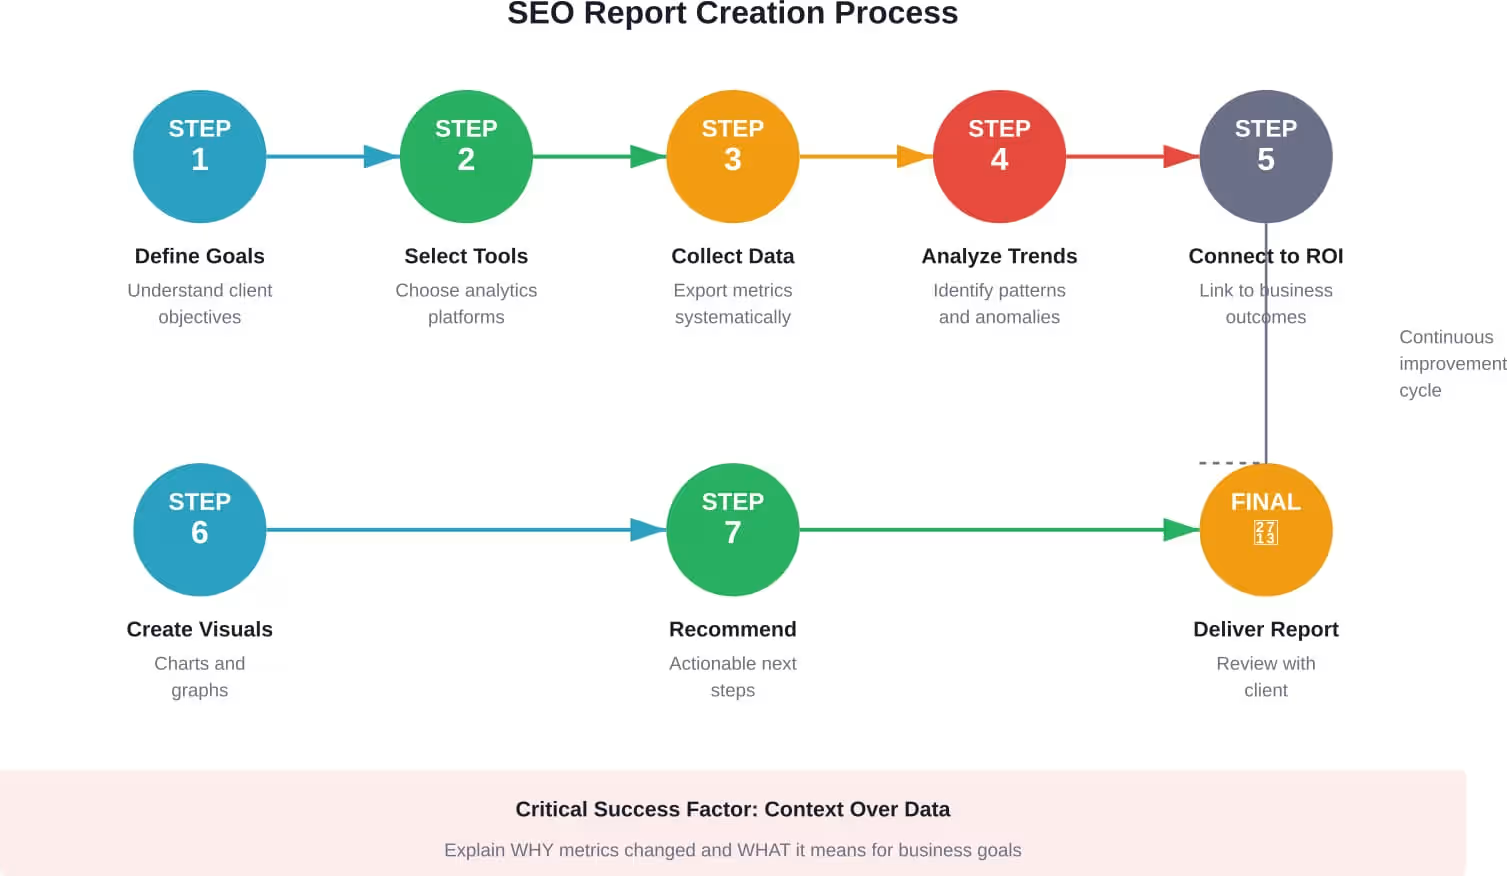
Building a meaningful SEO report requires more than pulling numbers from dashboards. It’s a structured process that starts with understanding client goals and ends with actionable recommendations.
Step 1: Define Client Goals and Success Metrics
Before opening any analytics tool, clarify what success looks like for this specific client. Different businesses have different priorities.
E-commerce sites care about transaction volume and revenue from organic traffic. Lead generation businesses want form submissions and qualified inquiries. Publishers focus on pageviews and ad revenue.
According to Moz’s consulting project planning guidance, what keeps consultants awake at night is how to shape projects to make them successful, requiring focus on planning and clear collaboration structures. Ask direct questions: What does a successful month look like? Which business metrics matter most?
Document these goals and reference them in every report. This creates continuity and shows how SEO activities connect to business outcomes.
Step 2: Select the Right Reporting Tools
Multiple tools are needed because no single platform provides complete visibility. Google Search Console shows how search engines see the site. Google Analytics tracks user behavior. Specialized SEO platforms monitor rankings, backlinks, and technical issues.
According to University of Illinois guidance on monthly SEO reporting, set up a monthly SEO report in Excel to aggregate your data and provide month-over-month insights.
Common tool combinations include:
- Google Search Console for search performance and indexing
- Google Analytics for traffic and conversion behavior
- SEMrush, Ahrefs, or Moz for rankings and competitive intelligence
- Screaming Frog or Sitebulb for technical audits
- PageSpeed Insights for Core Web Vitals
The specific tools matter less than consistency. Pick a stack and use it every month so data remains comparable.
Step 3: Collect and Organize Data
Create a standardized collection process. According to Google’s Search Console documentation, the Performance report allows data filtering by date range, making it easy to compare current performance against previous periods.
Export key datasets at the same time each month. Most agencies run reports covering the previous full month (e.g., March 1-31) and compare it to the month before.
Organize data logically. Group related metrics together—all traffic data in one section, all ranking data in another. This makes patterns easier to spot.
Step 4: Analyze Trends and Identify Patterns
Raw data without interpretation is useless. The analysis phase is where professional expertise shows.
Look for trends: Are rankings improving or declining? Is traffic growing consistently or sporadically? Are certain pages performing significantly better or worse?
According to Search Engine Journal, context matters when analyzing metrics. A 20% traffic drop might be concerning—unless it happened in January after strong December holiday traffic. Seasonality, algorithm updates, and competitive changes all affect results.
Identify anomalies and investigate causes. If rankings dropped suddenly, was there an algorithm update? Did a competitor launch new content? Did technical issues emerge?
Step 5: Connect Metrics to Business Outcomes
This is the most critical step and where most reports fall short. Translate SEO metrics into business language.
Instead of saying “organic traffic increased 15%,” say “organic traffic grew 15%, bringing an additional 1,200 qualified visitors who generated 48 new leads worth approximately $12,000 in potential revenue.”
Calculate actual ROI when possible. If the SEO investment is $3,000 monthly and it generates leads worth $12,000, that’s a 4x return.
Not everything converts immediately. Awareness and consideration-stage content builds the pipeline for future conversions. Explain this relationship so clients understand why rankings for top-of-funnel keywords matter.
Step 6: Create Visual Representations
Visual elements make reports scannable and help non-technical stakeholders grasp key points quickly.
Use charts to show trends over time. Line graphs work well for traffic patterns. Bar charts compare performance across different pages or keywords.
According to Moz’s guidance on SEO consulting deliverables, providing data and visual information makes it much easier for developers to understand what’s going on and gives reference points for future questions.
Keep visuals simple. Overly complex charts confuse rather than clarify. Each visual should communicate one clear point.
Step 7: Provide Actionable Recommendations
Every report should end with next steps. What specific actions should be taken based on current performance?
Recommendations should be prioritized. Not everything can happen at once, so rank suggestions by potential impact and effort required.
Be specific. Instead of “improve content quality,” write “update the product comparison guide to include pricing information and customer testimonials, which competitor analysis shows are ranking factors.”
According to Search Engine Journal, the weekly, monthly, and quarterly report cycles often become routine automated processes that get stale. Combat this by tailoring recommendations to current data rather than using generic checklists.
Different Types of SEO Reports for Various Purposes
Not all reports serve the same purpose. Different stakeholders need different information, and the reporting frequency varies based on the campaign stage.
Monthly Performance Reports
Monthly reports are the standard for ongoing client relationships. They track progress over time and show whether strategies are working.
According to University of Illinois SEO reporting guidance, monthly reports should aggregate data with month-over-month insights, including tabs for Search Console queries, pages, Google Analytics traffic, and key conversion metrics.
Keep monthly reports consistent in structure so clients can quickly compare periods. Highlight significant changes—both positive and negative—and explain what drove them.
Quarterly Strategic Reviews
Quarterly reports zoom out for a broader strategic view. They examine long-term trends, assess whether overall strategy is aligned with business goals, and plan the next quarter’s priorities.
These reports should include competitive analysis. How has the client’s visibility changed relative to competitors? Are competitors implementing new strategies worth considering?
Quarterly reviews are also the right time to revisit goals. Business priorities shift, and SEO strategy should adapt accordingly.
Technical SEO Audit Reports
Technical audits examine site health in depth. They identify issues that prevent search engines from properly crawling, indexing, and ranking content.
According to Moz’s guidance on site audit deliverables, providing raw data makes it much easier for developers to work out what’s going on and gives a reference point for future questions.
Technical reports should include:
- Crawl statistics and indexing status
- Site architecture and internal linking issues
- Mobile usability problems
- Page speed and Core Web Vitals
- Security issues and HTTPS implementation
- Structured data and schema markup status
Prioritize issues by severity. Critical problems that prevent indexing come first, followed by issues that limit ranking potential, then minor optimizations.
Keyword Research and Content Gap Reports
These reports identify opportunities. They show which keywords competitors rank for that the client doesn’t, what topics are trending in the industry, and where content investments would yield the highest return.
According to Michigan State University’s SEO strategy guidance, effective keyword research must align with the overall strategic plan and communications strategies for the organization.
Content gap reports should include search volume, competition level, and business relevance for each opportunity. Not every high-volume keyword is worth pursuing if it doesn’t align with what the business offers.
Backlink Audit and Link Building Reports
Backlink reports track link profile growth and quality. They show new links acquired, high-value opportunities pursued, and toxic links disavowed.
These reports should separate link building activities (outreach efforts, content promotion, partnership development) from results (actual links acquired, domain authority of referring sites).
Quality indicators matter. A link building report showing 50 new links means nothing if they’re all from low-quality directories. Better to show five links from industry-leading publications.
Best Practices for SEO Report Presentation
How reports are presented matters as much as what they contain. Poor presentation undermines good data.
Structure Reports for Scannability
Busy clients don’t read reports word-for-word. They scan for key points. Structure reports to support this behavior.
Start with an executive summary that answers: What happened this month? Is performance trending positively or negatively? What needs attention?
Use clear section headers. Group related information together. Put the most important findings first.
Use Clear Language and Avoid Jargon
Not everyone speaks SEO. Clients understand their business but may not know what Core Web Vitals or schema markup mean.
Explain technical concepts in plain language. Instead of “improved CLS score,” say “reduced visual shifting on mobile, making pages more stable as they load.”
When technical terms are necessary, include brief definitions or link to resources that explain them.
Tell a Story With Data
Good reports have a narrative arc. They don’t just list metrics; they explain what happened, why it happened, and what it means.
According to Search Engine Journal, the problem SEO professionals sometimes run into is not thinking about the report as a communication tool. Data doesn’t speak for itself.
Frame findings in terms of progress toward goals. “Organic traffic increased 18% this month, bringing us 75% of the way to the Q1 target of 15,000 monthly sessions.”
Balance Positive and Negative Findings
Honest reporting builds trust. Don’t hide problems or spin negative results.
When performance declines, explain why and what’s being done to address it. “Rankings for commercial keywords dropped an average of three positions due to a competitor’s aggressive content campaign. In response, we’re developing five new comparison guides to recapture visibility.”
Clients appreciate transparency. They lose confidence when reports always look perfect despite business metrics not improving.
Provide Context for Every Metric
Numbers without context are meaningless. Is 5,000 organic sessions good or bad? It depends on the industry, business size, and previous performance.
According to Search Engine Journal, context matters. A 20% traffic drop after strong holiday performance may be normal seasonality, not a problem.
Always show comparison data. Month-over-month and year-over-year comparisons reveal whether changes are meaningful or just noise.
Make Recommendations Specific and Prioritized
Generic advice doesn’t help. “Create better content” isn’t actionable. “Update the pricing page to include a feature comparison table and customer testimonials, which competitor analysis shows correlate with top rankings” is.
Prioritize recommendations by expected impact and effort required. This helps clients make informed decisions about resource allocation.
Automating SEO Reports Without Losing Strategic Value
Automation saves time but shouldn’t eliminate the human insight that makes reports valuable.
What to Automate
Data collection and basic visualization are perfect for automation. Pulling metrics from Google Analytics, Search Console, and rank tracking tools can happen automatically.
Dashboard tools like Google Data Studio (now Looker Studio), Databox, and similar platforms connect to data sources and update visualizations in real-time.
According to Greenlane Marketing, forward-thinking firms rely on APIs and data pipelines to automate reporting and reduce manual effort, while others depend on shallow, fully automated tools that offer little strategic value.
Automate the routine parts: data export, chart generation, trend calculation. This frees time for the valuable work—analysis and strategy.
What Should Stay Manual
Analysis, interpretation, and recommendations require human judgment. Algorithms can’t explain why rankings dropped or what strategic shift would help.
The narrative sections of reports—the executive summary, findings explanations, and next steps—should always be custom-written based on current data and context.
According to Search Engine Journal, the weekly, monthly, and quarterly report cycles can become routine, automated processes that get stale over time. Combat this by tailoring insights to each reporting period rather than using template language.
Building Effective Automated Dashboards
According to Search Engine Journal’s guidance on enterprise dashboards, the worst outcome is building a dashboard that stakeholders never look at.
Effective dashboards focus on metrics that matter to specific audiences. Executive dashboards show high-level business impact. Marketing team dashboards include operational details.
Update frequency matters. Daily traffic fluctuations usually aren’t meaningful. Monthly aggregates show real trends.
Include annotations explaining unusual spikes or drops. Even automated dashboards need context.
Common SEO Reporting Mistakes to Avoid
Even experienced professionals make reporting errors that undermine client relationships.
Focusing on Vanity Metrics
Impressions and page views look impressive but don’t necessarily indicate success. High traffic from irrelevant keywords doesn’t help business goals.
Focus on qualified traffic—visitors who match target audience profiles and engage meaningfully with content. Conversion rates matter more than raw visitor counts.
Reporting Without Context
A 10% traffic increase could be great or disappointing depending on expectations, industry trends, and previous performance. Always provide comparison points.
Explain external factors. Algorithm updates, seasonal patterns, competitive actions, and industry events all affect performance. Acknowledging these factors demonstrates expertise.
Making Reports Too Complex
More data doesn’t mean better reports. Overwhelming clients with dozens of metrics and charts makes it harder to identify what matters.
According to Search Engine Journal, over-reliance on metrics is a common problem. Not every measurement deserves report space.
Select the 5-8 metrics that most directly connect to client goals. Everything else is secondary.
Failing to Connect SEO to Business Outcomes
This is the biggest reporting mistake. SEO metrics should always link to business results.
According to Moz’s SEO Channel Context analysis, too often SEO analyses and decisions are made without considering the context of the marketing channel mix.
Show how SEO contributes to the broader marketing ecosystem. How does organic traffic compare to paid channels in conversion quality? What’s the cost per acquisition?
Using Industry Benchmarks Incorrectly
Benchmarks provide helpful context but shouldn’t be the primary success metric. Every business is unique.
A local service business and a national e-commerce site have completely different SEO realities. Comparing them to the same benchmarks is meaningless.
Use benchmarks as guideposts, not targets. The real measure of success is progress toward the specific client’s goals.
| Reporting Mistake | Why It’s Problematic | Better Approach |
|---|---|---|
| Only showing ranking improvements | Rankings don’t always correlate with business value | Show rankings plus resulting traffic and conversions |
| No year-over-year comparison | Misses seasonal patterns | Always include YoY data for context |
| Technical jargon without explanation | Client doesn’t understand findings | Use plain language or define terms |
| All positive, no challenges mentioned | Looks like spin, damages trust | Report honestly on both wins and challenges |
| Generic recommendations | Not actionable | Provide specific, prioritized next steps |
| Inconsistent report structure | Hard to compare across periods | Use standardized template monthly |
SEO Report Templates and Examples
Templates provide starting points but should be customized for each client’s specific needs and goals.
Basic Monthly SEO Report Structure
A standard monthly report typically includes these sections:
- Executive summary (key highlights and lowlights)
- Traffic overview (sessions, users, engagement metrics)
- Keyword performance (ranking changes for target terms)
- Top performing content (which pages attract the most organic traffic)
- Backlink summary (new and lost links)
- Technical health (Core Web Vitals and critical issues)
- Month-over-month comparison
- Recommendations and next steps
This structure works for most clients but should be adapted based on specific priorities.
Technical SEO Audit Template
Technical audits go deeper into site health:
- Crawl overview (pages crawled, crawl errors, blocked resources)
- Indexing status (pages indexed vs. submitted)
- Site architecture (internal linking, navigation structure)
- Mobile usability (responsive design issues, tap targets)
- Page speed and Core Web Vitals (LCP, INP, CLS scores)
- Security (HTTPS implementation, mixed content)
- Structured data (schema markup implementation)
- Duplicate content and canonicalization
- XML sitemap and robots.txt status
- Priority issues and recommendations
According to Moz, providing data makes it much easier for developers to understand issues and gives reference points for implementation.
Content Performance Report Template
Content-focused reports analyze what’s working and where opportunities exist:
- Top performing pages by organic traffic
- Pages with the highest conversion rates
- Content gaps (topics competitors cover that the client doesn’t)
- Keyword opportunities (high-value terms not yet targeted)
- Content needing updates (outdated pages losing rankings)
- User engagement metrics (time on page, bounce rate by content type)
- Content recommendations for next period
How to Present SEO Reports to Clients Effectively
The delivery method matters almost as much as the report content itself.
Schedule Regular Review Meetings
According to Moz, preparing for client meetings can be anxiety-inducing, and having a comprehensive plan at your fingertips relieves stress and sets up success.
Don’t just email reports. Schedule monthly review calls to walk through findings, answer questions, and discuss strategy.
These meetings build relationships and ensure clients actually engage with the data. Emailed reports often get filed away unread.
Tailor Presentations to the Audience
Different stakeholders need different information. Marketing directors care about channel performance and competitive positioning. CFOs want ROI calculations. CEOs need high-level summaries.
When presenting to multiple stakeholders, structure presentations in layers. Start with executive summary, then offer to dive deeper into specific areas based on questions.
Use Screen Sharing for Walkthrough
Live demonstrations make complex data more accessible. Walk through the report page by page, explaining key points and pausing for questions.
Screen sharing also allows for impromptu analysis. If a client asks about a specific page or keyword, pull up real-time data to answer immediately.
Encourage Questions and Discussion
Reports shouldn’t be one-way presentations. The most productive review meetings include back-and-forth discussion.
Ask clients what surprised them or what they’d like to understand better. These conversations reveal what metrics they truly care about and help refine future reports.
Follow Up With Action Items
Every meeting should end with clear next steps. Document these in meeting notes and include them in the next report to show progress on previous recommendations.
According to Moz’s consulting project planning guidance, establishing clear expectations and following through consistently builds trust and prevents projects from derailing.
Conclusion: Building Reports That Drive Results
Creating effective SEO reports for clients is both art and science. The science is selecting the right metrics, collecting data accurately, and tracking trends over time. The art is interpreting what those numbers mean and communicating insights in ways that drive action.
According to Search Engine Journal, successful client relationships are built on trust, and trust comes from transparent, meaningful communication. Reports aren’t just performance summaries—they’re tools for alignment, education, and strategic planning.
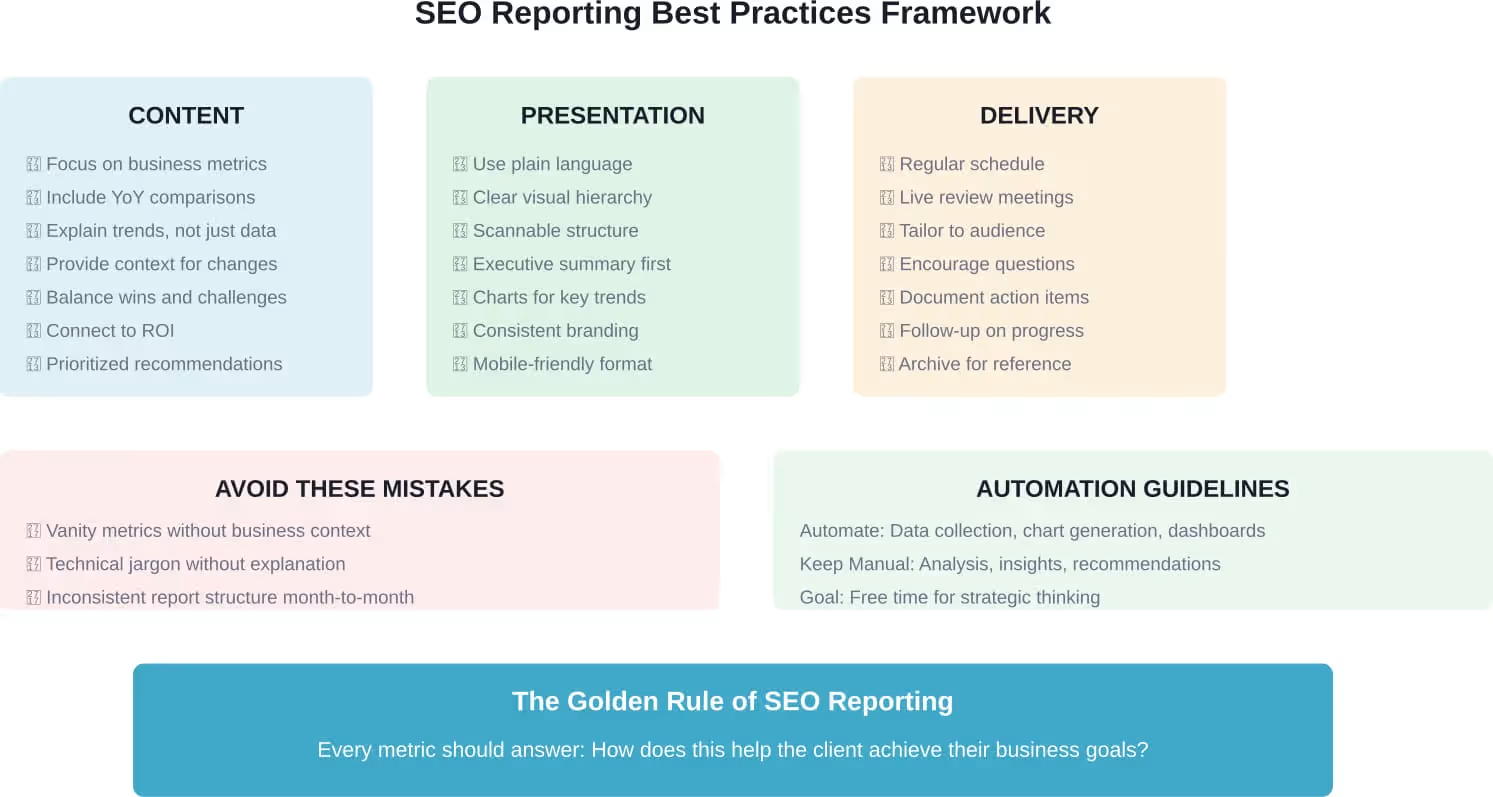
The best SEO reports share common characteristics: they focus on business outcomes over vanity metrics, provide context for every data point, balance positive and negative findings honestly, and end with specific, prioritized recommendations.
Automation helps with the routine parts—data collection, chart generation, dashboard updates. But the strategic elements—analysis, interpretation, storytelling—require human expertise. According to Greenlane Marketing, agencies that combine automated efficiency with strategic insight deliver the most value.
Remember that different clients need different reporting approaches. A local service business cares about different metrics than a national e-commerce site. A startup in growth mode has different priorities than an established enterprise protecting market share.
Tailor reports to specific situations. Ask questions. Understand what success looks like from the client’s perspective. Then build reporting systems that demonstrate progress toward those specific goals.
Good SEO reporting isn’t about proving how much work got done. It’s about showing how that work created measurable business value. When reports clearly connect SEO activities to outcomes that matter—more qualified leads, higher revenue, better brand visibility—clients understand the investment is worthwhile.
Start building better reports today. Review current reporting templates against the frameworks outlined here. Identify gaps. Add missing context. Improve visual presentation. Strengthen the connection between SEO metrics and business outcomes.
The time invested in better reporting pays dividends. Clear communication builds stronger client relationships, justifies continued investment, and creates alignment around strategic priorities. That’s how SEO programs sustain momentum and deliver long-term results.