


Executive Summary
Realistic SEO forecasting combines keyword-based projections with statistical trend analysis to predict organic traffic, conversions, and revenue. Data shows 54% of clicks go to the top three Google results, making accurate position and CTR projections critical. Forecasting helps secure stakeholder buy-in, guide resource allocation, and set achievable growth targets based on historical performance and competitive benchmarks.
Setting SEO goals without forecasting is like sailing without a compass. Teams publish content, track rankings, and watch analytics dashboards. But the nagging question remains: are these efforts actually moving the needle?
SEO forecasting transforms uncertainty into actionable intelligence. Rather than guessing whether traffic will double or stagnate, forecasting uses real data to project where organic performance is headed. The approach matters for agencies pitching clients, in-house teams securing budgets, and strategists proving ROI before writing a single word.
This guide breaks down two core forecasting methods, walks through the math behind traffic predictions, and shows how to present projections that stakeholders trust. No crystal balls required.
What SEO Forecasting Actually Means
SEO forecasting predicts future search performance based on current rankings, keyword data, and historical trends. It answers specific questions: How much traffic will this content strategy generate in six months? What conversion lift can the team expect? Which keywords deserve prioritization?
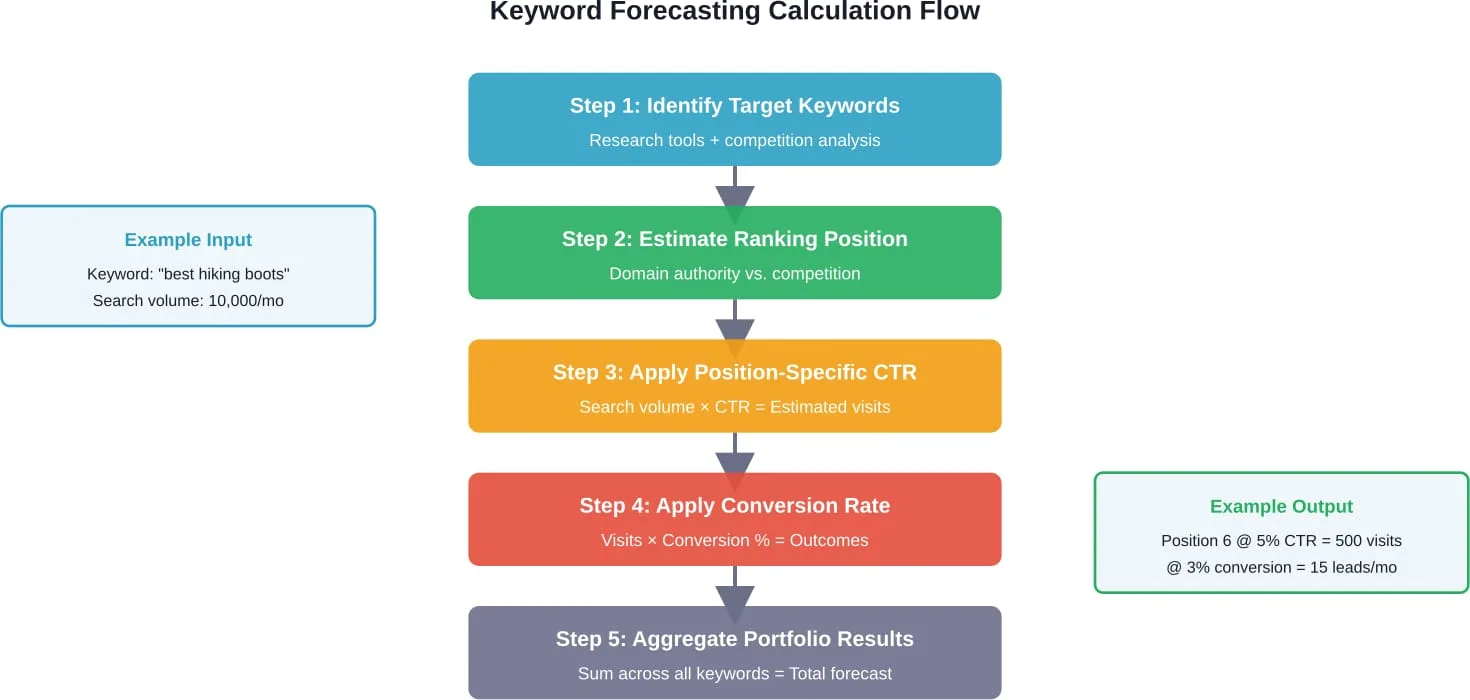
The process combines search volume data, click-through rates for different ranking positions, and conversion metrics. If a keyword gets 10,000 monthly searches and a page ranks position six with a 5% CTR, that keyword drives roughly 500 visits per month. Forecasting extends this logic across keyword portfolios and time horizons.
According to competitor content citing recent SEO stats, 54% of all clicks go to the first three Google search results, while only 0.44% of users venture to the second page. This data highlights why position matters dramatically in forecasting accuracy.
Why Forecasting Matters More in 2026
Search evolves faster than most strategies can adapt. Google’s February 2026 Discover core update introduced locally relevant content prioritization, shifting how articles surface across regions. Teams forecasting traffic must now account for geographic targeting and local competition dynamics.
AI-driven search features compound the complexity. According to Semrush research, AI search visitors to digital marketing and SEO-related topics may surpass traditional search visitors by early 2028. According to Semrush data, when ChatGPT search cites webpages, the pages it cites rank in traditional organic search positions 21+ for related queries almost 90% of the time, meaning forecasts built on position-one assumptions may overestimate traffic as AI adoption grows.
Budget conversations demand precision. Marketing leaders don’t accept “SEO is slow” as justification for spend. They want projections tied to revenue. As noted in enterprise SEO guidance, forecasts should frame requests like: “We need $50K to produce 100 articles. Based on past data, each brings in 30K visits in 24 months, generating $60K in revenue.” This reframes SEO as an investment with predictable returns.
Two Core Methods for Realistic Forecasting
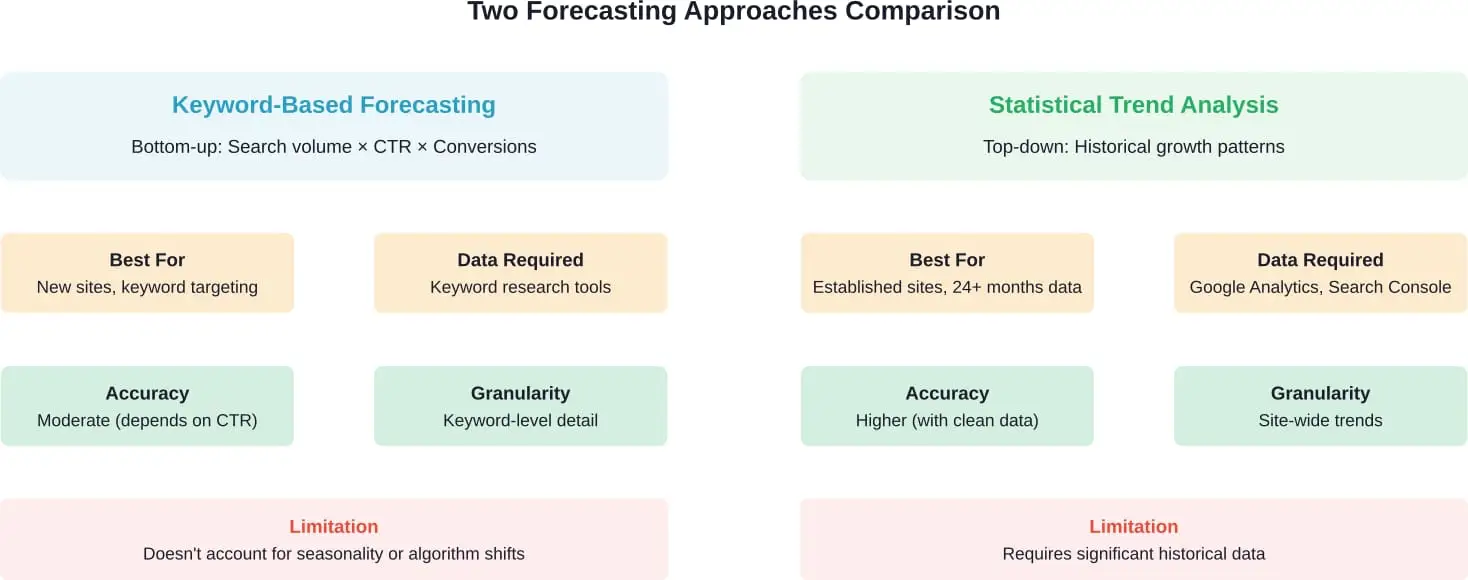
Forecasting isn’t one-size-fits-all. The method depends on data maturity, goals, and what questions need answers. Most teams use two approaches, sometimes in combination.
Method One: Keyword-Based Forecasting
This bottom-up approach builds projections keyword by keyword. It works when targeting specific terms, launching new content, or working with newer sites that lack 24 months of analytics data.
The formula looks straightforward: multiply monthly search volume by expected CTR for a target ranking position, then apply conversion rates. For example, imagine creating a page targeting “best hiking boots for women.” The keyword has 10,000 monthly searches. Current content ranks around position 10, but optimization aims to reach position six. Historical data shows position six captures roughly 5% of clicks.
The math: 10,000 searches × 5% CTR = 500 monthly visits. If the site converts 3% of visitors, that’s 15 conversions per month. Multiply by average order value to estimate revenue impact.
CTR assumptions matter enormously here. Position one doesn’t always capture 30% of clicks, especially for commercial queries where featured snippets or ads dominate. Tools like Semrush and SE Ranking provide keyword-specific CTR estimates based on SERP features, but manual adjustments based on actual Search Console data improve accuracy.
Method Two: Statistical Trend Analysis
Established sites with steady traffic histories benefit from trend-based forecasting. This top-down method analyzes historical growth patterns and projects them forward using time series models or simple moving averages.
If traffic grew 5% month-over-month for the past year, statistical models can project where that trajectory leads over the next quarter. The approach accounts for seasonal fluctuations better than keyword-level forecasts. December might consistently spike 20% above average, while August dips 10%. Trend analysis captures these patterns.
Google Analytics and Search Console provide the raw data. SE Ranking offers an Organic Traffic Forecast template that accepts historical traffic data and generates projections using predefined formulas. The output shows both table and chart formats, making it easier to visualize confidence intervals.
But here’s the challenge: trend analysis assumes continuity. Algorithm updates, competitive moves, or technical issues disrupt patterns. The forecast reflects what happens if everything continues as-is, not what happens when Google rolls out a February 2026 Discover update that reshuffles rankings.
Building a Keyword-Based Forecast Step by Step
Walking through the process with real numbers clarifies how keyword forecasting translates to business projections.
Step One: Identify Target Keywords
Start with keyword research that balances search volume, competition, and relevance. Tools like Ahrefs, Semrush, and Google’s Keyword Planner surface monthly search volume estimates. Focus on keywords where ranking improvements seem realistic given domain authority and content quality.
For a newer e-commerce site selling outdoor gear, targeting “best hiking backpacks under $100” (1,200 monthly searches) makes more sense than “hiking backpacks” (90,000 searches but dominated by REI and Patagonia). Match keyword difficulty to site strength.
Step Two: Estimate Realistic Ranking Positions
Optimism kills forecast credibility. Projecting position one for every keyword sets unrealistic expectations. Instead, use Ahrefs Domain Rating or Moz Domain Authority to benchmark against current top-rankers.
If competitors in positions one through five have DR scores of 70-80 and the forecasting site sits at DR 45, position six or seven becomes a more honest target. Adjust for content quality, backlink profiles, and existing topical authority. Tools like Ahrefs’ “Domain Comparison” feature show where sites realistically compete.
Step Three: Apply Position-Specific CTR Rates
CTR varies wildly by position and SERP features. Here’s a simplified position-to-CTR mapping based on aggregate industry data:
| Ranking Position | Estimated CTR | Notes |
|---|---|---|
| 1 | 28-35% | Lower if ads or featured snippets present |
| 2 | 13-18% | Second-choice fallback for many searchers |
| 3 | 9-12% | Still above the fold on most devices |
| 4-5 | 5-8% | Requires scrolling, lower visibility |
| 6-10 | 2-4% | Steep drop-off after position five |
| 11-20 | 0.5-1% | Second page territory, minimal traffic |
These percentages shift based on query intent. Branded searches show higher CTR for position one. Informational queries spread clicks more evenly. Always validate against Search Console CTR data for similar keywords the site already ranks for.
Step Four: Factor in Conversion Rates
Traffic means nothing without conversions. Forecasts must translate visits into measurable outcomes: leads, signups, purchases, or engagement metrics.
For new websites without historical conversion data, industry averages provide starting points. E-commerce sites typically convert 2-3% of organic visitors. B2B lead generation might see 5% conversion to qualified leads. SaaS free trial signups often run 8-12% for targeted organic traffic.
One example: a site targeting “gluten-free peanut butter cookies recipe” expects 5% conversion based on past recipe content performance. If the page captures 800 monthly visits at position four, that’s 40 conversions. If conversions mean email signups worth $2 each in future revenue, that keyword drives $80 monthly value.
Step Five: Scale Across Keyword Portfolio
Repeat the calculation for each target keyword. Aggregate the results to project total traffic and conversion lift. Spreadsheets work fine for 20-50 keywords. Larger keyword sets benefit from tools like Semrush’s Potential Traffic feature, which automates the volume × CTR × conversion math.
The output becomes a forecast table showing current state, projected state, and the delta between them. Break it down by time periods: 3 months, 6 months, 12 months. Conservative, moderate, and optimistic scenarios help frame uncertainty.
Building Statistical Forecasts from Historical Data
Sites with mature analytics histories unlock more sophisticated forecasting through time series analysis. This method doesn’t rely on keyword assumptions, instead projecting from observed performance.
Gathering Clean Historical Data
Export at least 24 months of organic traffic data from Google Analytics. Filter to organic search sessions only, excluding paid, referral, and direct traffic. Weekly or monthly aggregates work better than daily data, which shows too much noise.
Search Console provides complementary data: clicks, impressions, and average position over time. Cross-reference the two sources. Analytics sometimes shows traffic spikes from bot activity or referral miscategorization that doesn’t appear in Search Console.
Identifying Growth Patterns
Plot the data as a time series chart. Look for consistent trends: steady month-over-month growth, seasonal peaks, or plateau periods. Calculate the average monthly growth rate. If traffic grew from 50,000 to 66,000 sessions over 12 months, that’s roughly 2.5% compound monthly growth.
Simple moving averages smooth out month-to-month volatility. A three-month moving average shows whether the underlying trend tilts up, down, or flat. More sophisticated approaches use exponential smoothing or ARIMA models, but these require statistical software and expertise most marketing teams lack.
Projecting Forward with Confidence Intervals
Apply the historical growth rate to project future traffic. If the site averaged 2.5% monthly growth and ended last month at 66,000 sessions, the forecast for next month is 67,650 sessions (66,000 × 1.025). Six months out projects to roughly 76,000 sessions, assuming the growth rate holds.
But growth rates rarely hold perfectly. Include confidence intervals showing best-case and worst-case scenarios. If historical growth ranged from 1% to 4% monthly, the six-month forecast might show 70,000-82,000 sessions as the likely range. This frames uncertainty honestly.
Accounting for Seasonality
Many sites show predictable seasonal patterns. Retail spikes in Q4. Tax software peaks January through April. Outdoor gear surges in spring and summer. Statistical forecasts must adjust for these rhythms.
Calculate seasonal indices by comparing each month’s traffic to the annual average. If December consistently runs 30% above average, apply a 1.3x multiplier to December forecasts. July might run 10% below average, requiring a 0.9x adjustment.
Tools like SE Ranking’s forecast template include seasonal adjustment fields. Input historical monthly patterns, and the model automatically factors them into projections. This prevents over-forecasting quiet months or under-estimating peak periods.
Tools That Sharpen Forecasting Accuracy
Manual spreadsheet forecasting works, but specialized tools automate calculations, surface insights, and reduce errors.
Semrush Position Tracking and Potential Traffic
Semrush introduced AI-driven traffic predictions in late 2024, improving keyword-level forecasts. The Position Tracking tool now shows estimated traffic based on current rankings and projects changes if positions improve. The Potential Traffic feature estimates keyword opportunity before targeting it, helping prioritize which terms deserve content investment.
According to Semrush, this helps teams focus on the right keywords and make smarter decisions about content strategy. The tool surfaces keywords where small ranking improvements drive disproportionate traffic gains.
SE Ranking Organic Traffic Forecast Template
SE Ranking offers a pre-built template that accepts historical traffic data and generates projections using predefined formulas. The template outputs both table and chart formats, making it easier to visualize trends and share forecasts with stakeholders. Though no tool guarantees 100% accuracy, the template provides a starting framework teams can customize.
Google Analytics 4 and Predictive Metrics
GA4 includes basic predictive metrics like purchase probability and churn probability for sites with sufficient conversion volume. These aren’t SEO-specific forecasts, but they help estimate downstream value from organic traffic. If GA4 shows 10% purchase probability for organic visitors, forecasting 10,000 additional monthly visits implies 1,000 additional purchasers.
Custom Models in Google Sheets or Excel
For teams wanting full control, building custom forecast models in spreadsheets remains viable. Use formulas for growth rate calculations, seasonal adjustments, and scenario modeling. Conditional formatting highlights best-case and worst-case outcomes. Charts visualize projections against historical actuals.
The advantage: complete transparency. Stakeholders see every assumption and calculation. The disadvantage: manual updates and higher error risk compared to automated tools.
Turn SEO Forecasting Into A Plan You Can Execute
SEO forecasting usually falls apart when it is not tied to specific pages, realistic assumptions, and a clear set of actions. Lengreo works across SEO and digital marketing services, including SEO audits, keyword research, content planning, and link building, which are the inputs you need to make a forecast usable day to day. Instead of guessing, you can build a simple model around what will be updated, when it will go live, and what it should affect.
Ready To Make Your SEO Forecast More Realistic?
Talk with Lengreo to:
- Audit your site and list the technical issues that affect crawlability and indexing
- Map keywords to real pages, then forecast impact page by page
- Turn the forecast into a delivery plan (content updates, on-page fixes, links) with clear milestones
👉 Start by requesting a consultation through Lengreo’s website.
Common Forecasting Pitfalls and How to Avoid Them
Forecasting accuracy depends on honest inputs and realistic assumptions. Several predictable traps undermine credibility.
Over-Optimistic Position Projections
The most common mistake: assuming every keyword hits position one. Real talk: most sites can’t outrank established authorities on high-competition terms. Domain Rating differences matter. A DR 35 site won’t consistently beat DR 70 competitors, regardless of content quality.
Use tools like Ahrefs’ Domain Comparison to reality-check assumptions. If the top five results all have DR 60+, position six or seven becomes the honest target for a DR 40 site. Adjust forecasts accordingly rather than fantasizing about position one.
Ignoring SERP Feature Impact on CTR
Featured snippets, local packs, shopping carousels, and AI Overviews steal clicks from organic results. A position-one ranking doesn’t capture 30% CTR when three ad slots and a featured snippet sit above it.
Check the actual SERP for each target keyword. If answer boxes dominate, reduce CTR assumptions by 30-50%. If Google’s AI Overviews appear (increasingly common in 2026), expect further CTR compression. According to Semrush data, when ChatGPT search cites webpages, the pages it cites rank in traditional organic search positions 21+ for related queries almost 90% of the time, fundamentally altering CTR dynamics as AI search adoption grows.
Neglecting Algorithm Update Risk
Statistical forecasts assume the future resembles the past. Algorithm updates shatter that assumption. Google’s February 2026 Discover core update introduced locally relevant content prioritization, shifting rankings for thousands of sites overnight.
Build contingency into forecasts. If projecting 50% annual traffic growth, include a note: “Forecast assumes no major algorithm updates negatively impacting rankings. Update risk could reduce growth to 30-40%.” This frames uncertainty honestly rather than over-promising.
Confusing Traffic with Business Value
Traffic forecasts don’t equal revenue forecasts unless conversion rates hold steady. A spike in bottom-of-funnel keyword traffic drives more value than equal traffic from informational queries.
Always translate traffic projections into conversion and revenue estimates. If forecasting 100,000 additional annual visits but those visits convert at 1% versus the site average of 3%, the business impact is one-third of what simple traffic numbers suggest.
How to Present Forecasts That Stakeholders Trust
Forecast accuracy matters less than forecast credibility. Stakeholders need to understand the methodology, assumptions, and confidence levels. Transparency builds trust even when projections miss.
Lead with Methodology and Assumptions
Start presentations by explaining how the forecast was built. “This projection uses keyword-based forecasting, assuming we target 50 keywords with an average search volume of 2,500 and reach position 4-6 on 70% of them within six months.” Stakeholders appreciate knowing what’s baked into the numbers.
Document assumptions explicitly: CTR rates by position, conversion rate estimates, time to ranking improvements, and seasonal adjustments. Make the spreadsheet available so skeptics can interrogate the math.
Show Conservative, Moderate, and Optimistic Scenarios
Single-number forecasts set up binary win-or-lose outcomes. Scenario ranges acknowledge uncertainty. Conservative scenarios assume everything goes moderately well: rankings improve to position 8, not position 4. Optimistic scenarios assume best-case ranking improvements and higher-than-expected CTRs.
Frame it like: “Conservative case: 30,000 additional monthly visits. Moderate case: 50,000. Optimistic case: 75,000. We’re planning for the moderate scenario but preparing for the conservative outcome.”
Tie Forecasts to Budget and Resource Requests
Forecasts should frame budget requests with predictable returns: “We need $50K to produce 100 articles. Based on past data, each brings in 30K visits in 24 months, generating $60K in revenue.” This reframes SEO as an investment, not a gamble.
Calculate cost per forecasted visit and cost per forecasted conversion. If $50K investment projects 500,000 visits, that’s $0.10 per visit. Compare this to paid search costs ($2-5 per click) to demonstrate SEO’s efficiency.
Track Forecast vs. Actual Performance
The best forecasts include accountability. Show month-by-month forecast vs. actual performance. If May projected 40,000 visits but delivered 37,000, acknowledge the 7.5% miss and explain why (algorithm update, slower content production, seasonal factors).
This iterative refinement improves future forecasts. Stakeholders respect teams that learn from misses rather than ignoring them. Over time, forecast accuracy improves as teams calibrate assumptions against real outcomes.
Keeping Forecasts Accurate as Conditions Change
Forecasts aren’t set-and-forget documents. Conditions shift constantly: Google updates algorithms, competitors launch content, seasonality fluctuates, and technical issues crop up.
Monthly Forecast Reconciliation
Compare forecasted traffic against actual analytics data each month. If actuals consistently run 10-15% below projections, recalibrate CTR assumptions or extend the timeline for ranking improvements. If actuals exceed forecasts, investigate whether keyword cannibalization or unexpected ranking wins explain the variance.
Tools like Semrush Position Tracking automatically flag significant ranking changes, making it easier to spot forecast-breaking shifts early.
Algorithm Update Adjustments
Major algorithm updates require immediate forecast reassessment. Google’s February 2026 Discover core update shifted how articles surface across regions, impacting traffic for sites relying on Discover traffic. If an update drops rankings by five positions across the board, forecasts built on position-three assumptions become instantly obsolete.
Monitor Google Search Central Blog for official update announcements. When updates roll out, wait 2-3 weeks for rankings to stabilize before revising forecasts. Knee-jerk adjustments during volatile periods often overcorrect.
Competitive Landscape Shifts
New competitors or major content launches from established players change keyword difficulty mid-forecast. If a DR 80 site launches comprehensive content targeting the same keywords, reaching position four becomes harder. Adjust position targets and timelines accordingly.
Quarterly competitive audits catch these shifts. Use Ahrefs’ “Competing Domains” report to spot new players gaining visibility in the same keyword space.
Advanced Considerations for Mature Forecasting
Teams with forecasting experience can layer in more sophisticated elements that improve precision.
Cohort-Based Forecasting
Not all content performs identically. Blog posts, product pages, and landing pages attract different traffic volumes and conversion rates. Cohort-based forecasting segments projections by content type, applying different CTR and conversion assumptions to each cohort.
Product pages might convert 5% of visitors but only rank for 10-20 keywords each. Blog posts convert 0.5% but rank for hundreds of long-tail variations. Aggregate forecasts blending both cohorts provide more accurate total projections than single-coefficient models.
Backlink Velocity Integration
Forecasts can factor in planned link-building campaigns. If the team projects acquiring 30 high-quality backlinks over six months, estimate the DR lift this produces (use Ahrefs’ “Link Intersect” and competitor profiles to gauge impact). Higher DR translates to better ranking potential, which feeds back into position estimates.
This creates a feedback loop: link-building investment → DR increase → improved rankings → higher traffic. Quantifying this loop helps justify link-building spend alongside content production.
Cannibalization and Consolidation Effects
Launching new content sometimes cannibalizes existing pages rather than generating net-new traffic. Forecasting models should account for this. If adding a “best running shoes” page might split traffic with an existing “top athletic footwear” page, project the combined traffic rather than assuming pure addition.
Conversely, content consolidation often lifts traffic by strengthening page authority. Merging three weak pages into one comprehensive guide can double traffic to the combined topic. Factor consolidation plans into forecasts when applicable.

Real-World Examples of Forecasting in Action
Abstract methodology makes more sense through concrete examples showing how forecasting shapes strategy.
Example One: E-Commerce Site Forecasting Product Category Expansion
An outdoor gear retailer wants to add a “camping cookware” category. Keyword research identifies 80 relevant keywords with combined monthly search volume of 120,000. The site’s current DR is 52, while top-ranking competitors have DR 60-75.
The forecast assumes reaching position 5-7 on 60% of keywords within 12 months. Using conservative position-six CTR of 3%, projected traffic is 120,000 × 0.60 × 0.03 = 2,160 monthly visits at full maturity. Historical product page conversion rates run 4%, projecting 86 monthly orders. At $80 average order value, that’s $6,880 monthly revenue or $82,560 annually.
Content production costs $20,000 (product pages, guides, comparison articles). The forecast shows 4:1 ROI in year one, justifying the investment. The team proceeds with the expansion.
Example Two: SaaS Company Forecasting Blog Content ROI
A project management software company plans 50 blog posts targeting productivity and collaboration keywords. Historical data shows blog content takes 6 months to reach peak rankings and attracts 800 monthly visits per article on average.
The forecast projects 50 articles × 800 visits = 40,000 monthly visits at maturity (month 12). Blog content converts 8% to free trial signups, projecting 3,200 monthly signups. With 15% trial-to-paid conversion and $50 monthly subscription value, annual recurring revenue from this content cohort reaches $288,000.
Content production costs $75,000. The forecast shows breakeven by month 16 and 280% ROI over three years. The company approves the content strategy.
Turning Forecasts Into Strategic Advantage
Forecasting isn’t just about predicting numbers. It’s about making smarter decisions with limited resources.
Teams that forecast well prioritize high-impact keywords, avoid wasting effort on unwinnable terms, and demonstrate value before executing work. Forecasts secure budget by framing SEO as measurable investment rather than marketing faith. They guide hiring decisions by showing when traffic growth outpaces current team capacity.
The best forecasts acknowledge what they don’t know. Scenario ranges, documented assumptions, and monthly reconciliation build stakeholder trust even when projections miss. Transparency about methodology and limitations signals professional maturity.
Start simple. Pick five target keywords, estimate realistic positions, apply CTR rates, and calculate traffic projections. Compare the forecast against actuals three months later. Refine assumptions based on what the data reveals. Over time, forecasting becomes second nature, and accuracy improves through iteration.
SEO still requires patience. Rankings don’t change overnight. But forecasting replaces hope with evidence, guesswork with math, and vague promises with testable projections. That shift makes all the difference when fighting for resources, proving value, or simply answering the question: “Are we on track?”
Real-time data optimization enabled organizations to achieve results like a 635 percent increase in newsletter signups from a slide-in CTA and a 16 percent boost in product views through data-driven marketing decisions. By implementing systematic forecasting, teams can validate which tactics deliver measurable business outcomes.
Forecasting makes strategy tangible. It turns “let’s do SEO” into “let’s target these 30 keywords to generate 25,000 monthly visits and $40K revenue by Q3.” The second statement earns budget. The first gets ignored.
Ready to build your first forecast? Start with the keyword research you’ve already done, estimate realistic ranking positions based on competitive analysis, and run the math. Track actual performance against projections, adjust assumptions quarterly, and watch forecasting accuracy improve with each cycle.
Compliance and Regulatory Considerations
Banking SEO must navigate regulatory frameworks that don’t exist for most industries. These constraints shape strategy at every level.
Advertising and Disclosure Requirements
Financial advertising requires specific disclosures. Equal housing lender statements, FDIC membership notices, and product-specific disclaimers must appear on relevant pages.
The challenge? Implementing required disclosures without destroying user experience or search performance. Approaches include footer placement, expandable disclaimer sections, and dedicated disclosure pages linked from product content.
Privacy and Data Security
Federal Reserve guidance on information security standards establishes baseline requirements for protecting customer information. SEO implementations can’t compromise these security measures.
That means being cautious with third-party tools, ensuring analytics implementations don’t expose sensitive data, and maintaining secure infrastructure even when optimization might suggest otherwise.
Testimonial and Review Regulations
Banks face restrictions on how they use customer testimonials. Incentivized reviews raise regulatory concerns, and certain claims require substantiation.
These limitations affect review generation strategies and testimonial usage in content. But working within regulations is non-negotiable.
State-Specific Licensing
Multi-state banks must consider state licensing requirements. Advertising certain products in states where the institution lacks proper licensing creates compliance risks.
Geotargeting content and using location-based restrictions ensure marketing reaches only appropriate audiences.
Taking Action on Bank SEO
SEO for banks isn’t optional anymore. It’s fundamental infrastructure for customer acquisition in a digital-first banking environment.
The institutions that succeed don’t treat SEO as a marketing tactic to try when budgets allow. They integrate search optimization into digital strategy, technical development, content creation, and customer experience design.
Start with foundations: technical SEO audit, local profile optimization, and core content for high-priority services. These foundational elements create platforms for ongoing optimization.
Then build systematically. Add location-specific content. Develop informational resources that target early research queries. Strengthen E-E-A-T signals through author credentials and expert content. Earn quality backlinks through community involvement and valuable resources.
Most importantly, measure what matters. Connect organic search to business outcomes. Track application submissions from organic traffic. Calculate customer acquisition costs. Demonstrate ROI to internal stakeholders.
As ABA’s recent research emphasizes, banks that balance proven tactics with forward-looking strategies like AI will be best positioned for sustainable growth. SEO represents both proven tactics—search has driven customer acquisition for decades—and forward-looking strategy as search interfaces evolve.
The banks winning organic search in 2026 and beyond share common traits: they invest in user experience, create genuinely helpful content, optimize for both humans and search engines, and maintain consistent effort over time.
Competition for search visibility will only intensify. Starting now—or accelerating existing efforts—positions financial institutions to capture the customers actively searching for banking services rather than watching them choose competitors who show up first.